Archive for category PERA
Jefferson County Schools Propose Retirement Plan Default
Posted by Joshua Sharf in Colorado Politics, PERA, PPC on November 25th, 2012
Welcome, Instapundit readers! While you’re here, take a look at posts on Certificates of Participation. Perhaps your state has something similar…
On Thursday, November 8, the Jefferson County School Board voted to ask teachers participating in its Supplemental Retirement Program to take a buyout for what would amount to about 64 cents on the dollar.
By following other public pension systems into what amounts to a default – albeit partial – JeffCo Public Schools join the parade of cautionary tales for those relying on the promises of public programs like PERA. As Glenn Reynolds of Instapundit is fond of reminding us, promises that cannot be kept, won’t.
History of the Plan
Quoting from a 2009 RFP for a plan financial advisor (emphasis added):
The Supplemental Retirement Plan was created in 1999 for employees who worked in full-time or job-share positions which were covered by an association. It was designed to replace a bonus-type program for retirees who met age and service requirements, with a tax-advantaged vehicle. Benefits are intended to supplement, not replace, PERA retirement benefits. Participation in the plan was immediately frozen upon its creation.
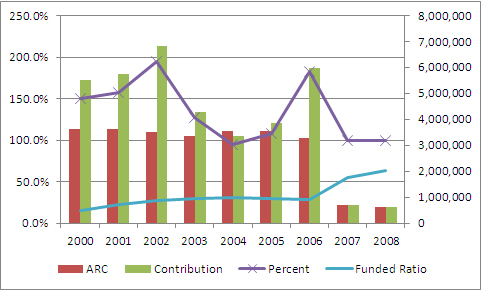
The District had originally committed to fund $90 million dollars toward a combination of pension plan benefits and sick and personal leave payouts at a rate of $9,000,000 per year for 10 years. However, budget cuts reduced the annual plan contributions and stretched out the plan’s original funding timetable. The plan has been underfunded since its creation. In 2007, the District purchased certificates of participation and deposited the funds into the plan for the purpose of meeting its stated funding obligations and has now exceeded its original funding commitment. Further contributions to the plan are not likely to be made. Subsequently, existing retirees and employees who met the full vesting requirements of 20 years of eligible service and age 55 were offered a one-time ability to have their benefits satisfied with a lump-sum payout at the plan’s stated discount rate. As a result, participant count, liabilities and assets have decreased in the plan and the overall funded status of the plan has improved. It is anticipated that at some point the plan will need to declare actuarial necessity and terminate or reduce plan benefits for non-vested participants. After the lump-sum payouts, the plan amended its investment policy to be more conservative, in an effort to protect the funding of benefits for existing retirees and vested participants.
The plan wasn’t underfunded for lack of district contributions. According to the latest available plan financials, also from 2009, the district met or exceeded its annual contribution every year until 2009, with the exception of a slight shortfall in 2004. The combination of payouts and lower-than-necessary returns kept the plan funding under 32%, until the 2006 issuance of $37 million of Certificates of Participation (more about that in a coming post) reduced the outstanding obligations starting in 2007.
As of the 2009 report, the plan had $20.8 million in obligations, $7.4 million of which were unfunded.
Issues with Transparency
There appear to be a number of significant transparency issues with the way the plan has been handled.
The November 8 meeting itself raises issues of transparency and obligations of full disclosure to the public. The meeting discussion was held in a 45-minute executive session. Executive session is supposed to be reserved for legal advice, not for general discussion of motions before the Board. It is unthinkable that the Board received a 45-minute legal briefing, after which it proceeded directly to a vote.
Moreover, at least the topic of an executive session is required by law to be posted in advance of the meeting. Here’s the notice that was posted outside the Board’s meeting room the evening of November 8:

There is, evidently, case law to suggest that the recording of the Executive Session should therefore be made public, since the session – although not the vote – were conducted in violation of statute.
The most recent financials available online date from 2009, three years ago. Even in the absence of significant financial changes, plan financials from the most recent year should always be available.
Also note that the teachers were offered a buyout in 2006 – which the smart money, including current Superintendent Cindy Stevenson took – the 2009 statement RFP for a plan financial advisor all but admits that the plan will terminate and default on the remaining obligations at some point. Whether or not this likelihood was made clear to the teachers who chose to remain with the plan in 2006 is unclear. What it clear is that Stevenson, and possibly current Board member Jill Fellman, were made whole during the 2006 buyout offer, while other teachers were not.
UPDATE: According to the FY2011 Comprehensive Annual Financial Report, in 2011, the Board decided to terminate benefits for anyone who hadn’t reached the thresholds of age 50, and 20 years of service as of the end of the 2011 plan year, 8/31/2011. “The plan is still operational for active and deferred vested participants and beneficiaries in receipt of payment.” It is those members who will be asked to take a cut in their benefits. The district has also “determined that additional contributions for the foreseeable future would not be made to the Plan.” (Note 16, P. 72)
The funded ratio has fallen to 50.6%, and the unfunded liability as of August 31, 2010 is $8.8 million.
Correction: No vote was actually taken at the November meeting. (I left early because of the descent into executive session.) It is likely that there will be a vote at the December or January meeting. Stay Tuned.
PERA Gains a New Client Group
Posted by Joshua Sharf in Budget, Business, Colorado Politics, Economics, PERA, PPC on October 19th, 2012
What makes it so hard to fight the growth of government is its ability to create client groups seemingly at will, with the money of the very people it’s seeking to co-opt. I see it myself all the time at the JCRC, where what had been private, service groups are reduced to begging for scraps and favors in front of legislative committees. At one time they thought it more expedient to do that than to make the case for the value of their work to the community they served and represented. Now they’re caught, and even when they’re not temperamentally inclined to go along with the leftist agenda, they often do because they can no longer imagine doing business without government support.
So it happens with PERA, too, which has announced the Colorado Mile High Fund, a fund geared towards investing in Colorado entrepreneurs who have partners, but are also having a hard time finding additional capital.
“We heard from businesses around the state during the development of the Colorado Blueprint that increased access to capital is critical to their success and that of our state’s economy,” said Gov. John Hickenlooper. “The creation of the Colorado Mile High Fund will improve that access to capital and we are pleased that Colorado PERA’s partnership will benefit and help grow companies here in Colorado.”
The risks to the taxpayers and the foolishness of this sort of government adventure are all around us, but it’s hard to tell if that’s a bug or a feature of this plan. I don’t think PERA’s out to deliberately lose money, but investing in high-risk start-ups may not be the best decision for a defined benefit retirement fund.
Even if this turns out to be one fund in the option and under-used 401(k) option, entrepreneurs and start-ups will now have a reason to support increased funding for a government-sponsored employee retirement plan, whose money much come from the pockets of the taxpayer. The most dynamic sector of the state’s economy will be effectively recruited on behalf of its most stifling.
How Does PERA Rate?
Posted by Joshua Sharf in Budget, Colorado Politics, Finance, PERA, PPC on August 15th, 2012
Not well. According to its latest Comprehensive Annual Financial Report, PERA has an unfunded liability of $25 billion, up from $15 billion last year, mostly because of a dismal rate of return in 2011, roughly 1.9%. Much of the criticism of public pensions has centered on their unrealistic expected rates of return, 8% in PERA’s case. This is certainly a cause of concern. While 8% is not unrealistic for equities historically, most people consider it to be wildly optimistic, certainly for the near future. And in any case, a constant rate of return doesn’t take into account the volatility of those returns.
But there’s a second rate, the discount rate, which PERA also has to estimate. It signifies something else altogether, and like the discount rate, PERA’s assumptions regarding the discount rate serve to make the fund look more solvent than it actually is.
What is a discount rate?
Another term for the discount rate is the “required rate of return,” not by the plan, but by the investors in the plan. In some sense, you can think of it as the Rate of Return in reverse.
The Rate of Return is used to estimate how much today’s investment will be worth tomorrow. PERA assumes an 8% rate of return, and for the moment, let’s humor them. This means that $1,000 today will be worth almost exactly $10,000 in 30 years.
The discount rate works in reverse. If I know that I’m going to need $10,000 in 30 years, then I can run that number in reverse, discounting by 8% each year, until I see that I need $1,000 in the bank today to be able to meet that obligation.
PERA, like most government pensions, uses the assumed Rate of Return as the Discount Rate. If you have $1,000 in the bank, after all, you have enough to cover a $10,000 obligation.
Why not?
Because in this case, the discount rate is supposed to discount back obligations, not assets. It is suppose to represent the required Rate of Return of the investors, in this case, the pensioners. And since the pensioners’ assets (their PERA benefit) is the same as PERA’s obligations, PERA should use the Rate of Return that pensioners should expect on their investment.
What rate is that? Basic economics says that risk needs to match return. The market should price assets with the same risk at the same Rate of Return. Otherwise, for two assets with the same risk, an investor could sell the one at the lower rate of return, and buy at the higher rate, and not have any risk at all. Obviously that’s not sustainable.
So the trick is to find an investment with roughly the same risk as PERA, and use its return as PERA’s discount rate. PERA is a contractual obligation by the state, much like a long-term bond. It can probably change the terms of PERA more easily than it could default on a long-term bond, but again, let’s assume that these are pretty close to having the same level of contractual obligation, and therefore, from the investors’ point of view, the same risk.
This is what private pensions have to do. A corporate pension would use, as its discount rate, a mix of high-quality corporate debt, because that’s market-traded debt at the same level of obligation as its pension obligation. It’s only by the grace of the Government Accounting Standards Board (GASB), that PERA and other public pensions can get away with the higher discount rate.
Right now, according to MunicipalBonds.com, Colorado has long-term revenue bonds trading between 4,5% and 5%. Conveniently, if we use 4.75%, a $10,000 obligation translates to $2500 today.
So What Does This Mean?
Well, in our example, it shows how the level of fundedness is dependent on the choice of discount rate regardless of whether or not the 8% Rate of Return is realistic. If PERA has $1,000 in stocks, and chooses a discount rate of 8%, it looks as though it’s fully-funded. But if PERA is forced by accounting standards to choose the (more correct) discount rate of 4.75%, it’s underfunded by $1500, and is only 40% funded – even if we can realistically expect 8%.
That’s because the two rates really don’t have anything to do with each other. One is the rate of return PERA expects on its assets from its own investments. The other is the rate of return that pensioners expect on their investment. What PERA invests its money in is a policy decision. It may be good or bad policy, but pensioners expect to be paid, just the same as bondholders do, and that’s what determines the riskiness of the pension as an investment, not whether or not management puts it in gold bars or decides to go to Vegas and put it all on Red.
Ideally, PERA would match its return to its obligations. It would invest at something that also returned 4.75%, and have $2500 in the bank to be able to cover the $10,000 obligation, 30 years from now.
When it’s allowed to select a higher discount rate, though, it can get away with looking fully-funded with a much less money. Obviously, it has every incentive to do that. To do that, it has to seek investments with higher expected return. But in chasing higher returns, it’s also taking on additional risk.
Not only does the higher discount rate make PERA look more solvent than it is. It also encourages it to make riskier investments with its pensioner’s money.
Moody’s Sees Bloomberg’s “Laughable” And Raises…
Posted by Joshua Sharf in Colorado Politics, PERA, PPC on July 13th, 2012
Being State Treasurer and trying to hold the Colorado Public Employees’ Retirement Association (PERA) to account can be a frustrating experience, as Walker Stapleton shared with Sean Hannity on Fox News Channel in June:
“I asked for some basic financial information about the defined benefit plan, where people were promised a rate of return, a massively inflated rate of return of 8%, Sean, that everybody from Warren Buffett to Michael Bloomberg have said is ridiculous and insane and preposterous. And they keep this rate of return promise, on purpose, to pervasively underfund the plan, and create a liability on the backs of our kids and their kids, and future generations of Americans.”
Now, it’s not just Mayor Bloomberg, it’s Moody’s.
Moody’s Investors Service has asked for comment on a proposed adjustment to its valuation of the public pension liability in the United States. One of those changes would lower both the discount rate and the expected rate of return to a standard of 5.5%.
This would have the effect of tripling the estimated unfunded liability, from $766 billion to $2.2 trillion.
Trillion.
With a T.
PERA has more than 97,000 current benefit recipients receiving an average monthly benefit of nearly $3,000. It runs a sensitivity analysis on its liability, varying the rate of return and the discount rate from 9.5% (no adjectives need apply) to a merely overstated 6.5%. At 6.5%, it is barely 50% funded, and Colorado’s unfunded liability is just a shade under $37 billion.
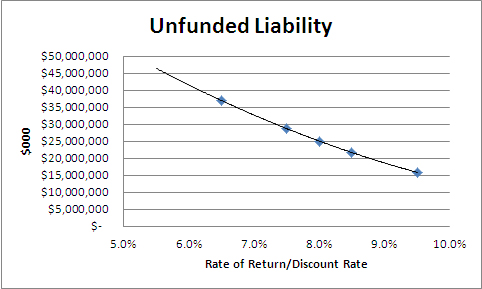
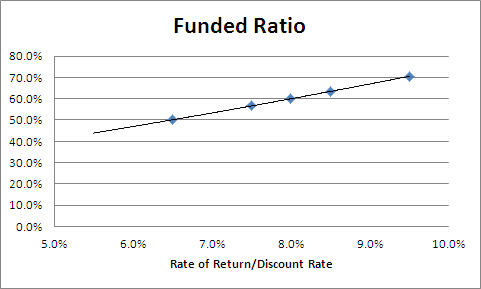
A reasonable estimation back to 5.5% puts the unfunded liability at $45 billion, and the funded rate near death-spiral territory at 43.8%. I’m sure that when PERA releases its 2012 annual financial report in about a year, they’ll have done those calculations themselves. Here’s the recently released 2011 version.
Stapleton, a PERA board member, sued last year to get access to PERA records. That effort was rebuffed in Denver District Court in April.
“This is a battle for transparency that is going on all across our country,” Stapleton said on Hannity’s show. “It’s critical that we win this battle, because it’s critical for state budgets going forward.”
Amortize This!
Posted by Joshua Sharf in Education, Finance, PERA, PPC on July 6th, 2012
In Pension accounting, the amortization period is how long it would take to pay off the current unfunded liability, based on current contributions, and current employees.
Typically, pensions try to keep that time at about 30 years, or a normal, long career. That does a pretty good job of matching contributions to liabilities.
The amortization period for PERA’s school fund is now 59 years.
PERA’s retirement age is 58.
Retirees who haven’t even been born yet are having their benefits amortized by current contributions.
Sleep well.
Devouring the School Budget From Within
Posted by Joshua Sharf in Education, PERA, PPC on July 6th, 2012
PERA’s problems don’t stop with the state. While the Colorado government has consistently shorted PERA on its Annual Contribution (theoretical) Requirement, local school districts have less flexibility in kicking the can down the road. As a result, their PERA contributions have increased rapidly, in some cases very rapidly, over the last decade or so. Here are the compound annual growth rates for four of the largest school districts from 2003 – 2011 (except for Cherry Creek, for which data was only available starting in 2006).

These numbers include all PERA contributions, both to the School Trust Fund and to the Health Care Trust Fund HCTF).
What does this mean for school budgets? Well, taking the Schedule 4 disclosures in the Statistical sections, we can derive the annual operating expenditures. For the government funds, we take the total expenses, subtract out the CapEx and the Debt Service, and then divide that number into the annual PERA contribution (described three years rolling in the Financial Section Notes).
The result? Not pretty:
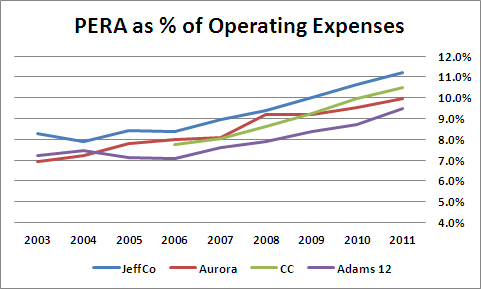
The role of debt service in school finance is another matter well worth examining, but in this case, adding it in would just alter the level, not the trend. But consider that in JeffCo, 1 in every 9 dollars goes to PERA. In Cherry Creek and Aurora, it’s 1 in 10 dollars.
It’s not that school spending isn’t rising. It’s that PERA contributions are skyrocketing. And school budgets are starting to feel the pressure.
UPDATE: A typo in the Cherry Creek numbers prior to 2009 exaggerated the rate of increase, and created a “knee” in the data between 2008 and 2009. The 2006-2008 contributions were actually higher than I had reported. I’ve corrected the charts.
PERA – Wait Till Your GASB Gets Home
Posted by Joshua Sharf in PERA, PPC on June 29th, 2012
So we knew that when the new Government Accounting Standards Board requirements for public pension reporting came out, reported funding levels across the country would drop like a rock, but we didn’t really know how much.
Turns out that the good folks at the Center for Retirement Research at Boston College did some of that work for us a couple of years ago, studying 127 public pensions across the country.
Remember, the new standards have two parts: pensions must report their holdings at current market value, and not average those values over 3-5 years as they had before. And the unfunded liabilities, the portion that they do not believe are funded by current holdings, would have to be discounted at the long-term borrowing rate for the municipality involved, producing a blended rate likely lower than then expected return, and thereby decreasing the apparent funded level.
As of 2009, the numbers for Colorado didn’t look good at all. The school portion of PERA would fall from 65% funded to 52%, and the state portion from 63% to 48%. With current funded levels slightly lower, the actuals are also likely lower now.
It’s important to remember that these are accounting changes, and that the plans didn’t suddenly become less solvent overnight. But as a better reflection of reality, they are still pretty sobering.
Many Not-So-Happy Returns for PERA
Posted by Joshua Sharf in Budget, Colorado Politics, PERA, PPC on June 26th, 2012
As PERA prepares to release its 2011 Comprehensive Annual Financial Report, keep an eye on 2011’s returns. Treasurer Walker Stapleton understatedly calls 2001’s anemic 1.8% return, a “serious warning sign.” I’d call it a big, red, flashing LED billboard.
“What’s the big deal? It’s only one year,” I hear you cry.
Well, it turns out that if you’re projecting returns over a long period, the early returns have a disproportionate effect on whether or not you’ll make your targets. And while PERA projects an overly-optimistic 8% annual return, even meeting that as an average cumulative return is no guarantee of solvency to the end.
Returns aren’t smooth, they vary over time, and while the exact distribution is a matter of dispute, that fact isn’t. While the actuarial outlays are relatively smooth, returns can bounce around all over the place, and poor early returns can mean that you’re eating into your principal, and won’t be able to make it up on the back end, even if the returns rise to meet your project cumulative average.
Take three sets of return profiles, one constant, one with slightly higher-than-expected returns the first two years, and one where the fund loses 5% a year for the first two years, but settles in at a higher rate.

All of them converge to the save Cumulative average at the end of the 20-year run:

But because they have to take money out each year, the end of year balances tell a starkly different story for the three funds:

One fund slowly declines from $1 million balance to $800K. The one with higher early returns also declines, but ends up above its starting balance. And the one with poor early returns never recovers.
In fact, 20 data points is a very small sample, and even a distribution of returns that averages 8% could easily produce, over 20 samples, returns far higher or, more likely, far lower. The graph below shows the average returns and final balances from a 10,000-run Monte Carlo simulation:

Below about 10%, there’s a virtual guarantee that some of the funds will go bankrupt. Let me emphasize that this is a very simplified model, for display purposes only. Do not try this at home. (Actually, go ahead and try this at home. You’ll probably be as depressed and I was.)
What this shows, though, is that even using a lower rate of return doesn’t necessarily guarantee the fund’s soundness, and certainly doesn’t model the fund’s future. The only way to do that is through a Monte Carlo simulation, using the historical returns of the assets in which the fund is invested.
While more complex to do, and very hard to model on a spreadsheet, there is precedent for incorporating Monte Carlo modeling into financial planning, pension solvency analysis, and even into accounting. The Black-Scholes method, for instance, is used to calculate the value of stock options granted to employees and expensed on corporate financial statements. And allowances for bad debt are routinely audited for fidelity to previous customer defaults. There’s no reason that we couldn’t require pensions to do the same.
At the very least, it would perhaps keep today’s 1.8% return announcements from being such a surprise, and from taking such a toll on PERA’s solvency estimates.
PERA, the Unions, and You
Posted by Joshua Sharf in Education, PERA, PPC on June 3rd, 2012
One of the less-noticed points of contention at Douglas County’s open negotiations the other week was the status of school district employees who are actually on the union payroll. Basically, union heads leave the classroom to spend their time representing teachers and the union, yet remain officially school district employees. The district wants to end this practice, and in fact, pick-slipped the union heads a couple of weeks ago. The union wants to retain them as district employees, and claims that this is a non-issue, as the union reimburses the district for the employees’ salaries and PERA contributions.
The problem isn’t the current costs – although there may be some conflicts of interest in having a union boss refuse supervision and evaluation by the district, while still remaining nominally an employee. The problem is PERA, and its something that the retirement plan ought to look at.
What happens here is that the unions, the national, state, and local, pay this employee’s salary. That salary is no longer determined by the seniority or performance measures that apply to all other teachers, but by the people actually paying the salary. So that employee is no longer being paid on their value to the district, or to the students, but to the union. Their PERA benefits, which, over their lifetime, are calculated based on that salary. Which means that PERA is paying benefits to potentially hundreds of employees statewide based not on their service to the taxpayers, but on their service to the union. And since those benefits will, as currently constituted, far exceed the amount paid into the system, they constitute a net payout to the union, which doesn’t have to cover their own employees’ retirement benefits for those year.
The union will say that it’s unfair that a teacher should have to give up earned retirement benefits when they become a union rep. But of course, they don’t have to give up anything they’re vested in. This is, in the end, no different from a bureaucrat or a regulator leaving to take a job as a lobbyist. They’re no longer directly serving the state government, and should no longer be a part of the state government retirement system, except for the benefits they have earned. The union will argue that this will make becoming a union rep a much less desirable position, but never explain why that desirability should come at the direct expense of the taxpayer rather than the union and the teachers it represents.
PERA’s Benchmarks
Posted by Joshua Sharf in PERA, PPC on June 1st, 2012
Along with all my other exciting duties, I’ve taken on the role as the manager of the PERA Project for the Independence Institute’s Fiscal Policy Center. It’s an astonishing amount of material to become acquainted with, but I’m starting with the most recent Comprehensive Annual Financial Report, from 2010 (the 2011 report won’t be ready until July, for some reason).
Most funds try to achieve some level of diversification within their target investments. This is true even for narrow, industry-specific funds, but is clearly true for larger, broad-based funds like a retirement fund, whose primary goal needs to be capital preservation and conservative growth.
In PERA’s case, they divide their investments into five asset classes: stocks, bonds, real estate, commodities, and alternative investments. While there’s some correlation among these, they are true asset classes, meaning that they really do respond to different economic conditions and stimuli. While a generalized, panicky flight for the exits would affect them all, for the most part, these investments don’t move in tandem.
However, the benchmarks against which PERA measures its performance are another matter, and may be setting the fund up for diminished returns.
The benchmarks themselves are not only highly correlated, in several cases, they’re just the same as each other:
| Global Benchmark | |
| DJ US Total Stock Market Index | |
| MSCI ACWI ex-US Index | |
| Fixed Income Custom Benchmark | |
| Barclays Capital Universal Bond Index | |
| Barclays Capital Long Gov’t Credit Index | |
| Alternative Custom Benchmark | |
| DJ US Total Stock Market Index + 3% | |
| Real Estate Custom Benchmark | |
| NCREIF Open-end Core Fund Index + 1% | |
| Opportunity Fund | |
| DJ US Total Stock Market Index | |
| MSCI ACWI ex-US Index | |
| Fixed Income Custom Benchmark | |
There are some questions here. First, the “Opportunity Fund” is currently invested in timber and raw materials. Surely there must be commodity indexes that would be more reflective of the fund’s style. A mixture of equities and fixed income indices doesn’t seem to bear any relationship to the fund’s investments.
Second, fund managers are judged in part by how well they track or beat these benchmarks, PERA is potentially setting up incentives to invest in assets that are reflected in those indices, throwing away the benefits of diversification. The Opportunity Fund, for instance, is being judged on what amounts to a combination of the Global and Fixed Income Benchmarks. It may be in commodities or timber now, but it could well end up migrating to investments that track those other two funds.
The Alternative Investment Fund is the most problematic; in essence, it’s just being held to the US stock market plus 3%. But look at its portfolio: private equity, venture capital, and distressed debt. Those investments don’t necessarily peak at the same point in the business cycle as vanilla equities. The difficulties and dangers of benchmarking alternative investments, which are often illiquid and lacking in direct peers, have been noted before. But there are any number of hedge fund indexes available for them to use. Surely some basket of those would be more reflective of the fund’s actual and intended holdings.
I’ve only just noticed this, and to be fair, I don’t have any evidence that it’s actually affecting investment decisions. Moreover, it’s a second-order effect. Obviously, this isn’t as bad as if the asset classes themselves were highly-correlated. But it’s possible that PERA is creating investing incentives that could come back to bite them in bad years, and cost them valuable basis points in normal years.
-
You are currently browsing the archives for the PERA category.


