Archive for category PERA
SB200 Passes the Senate With No Democrat Votes
Posted by Joshua Sharf in PERA on March 27th, 2018
 SB200, the PERA reform bill, has passed the State Senate on a party-line 19-16 vote, with Sen. Cheri Jahn (U) joining the majority Republicans in support.
It faces a tougher road in House, where the Democrats have a 10-seat majority, pending a Republican successor to evicted Rep. Steve Lebsock (D-R) in House District 34. But the bill has Democratic support, even among leadership. Majority Leader K.C. Becker (D) is one of the sponsors, and she’s been working with Sen. Jack Tate (R) since the beginning to get something written that can both pass and do more than just tweak things until the next crisis.
With a minority in the Senate, and the Republicans solidly behind the bill as amended, it was easy for Democrats to vote to oppose. They took no risk in doing so. What they could do was propose amendments that laid down markers for what the unions party expects to see changed coming out of the House and headed into a presumed conference committee. I covered those in a previous post, but they amount to:
- Reducing the employee contribution increase
- Increasing the employer contribution
- Not increasing the retirement age
- Not expanding access to the Defined Contribution plan
- Increasing the COLA cap
- Eliminating the new oversight committee
Now is where the Senate Republicans and House Democrats who have been leading the effort will really be tested. The needle to thread is much narrower, with Republicans more likely to vote against a substantially weakened bill, but Democrats potentially demanding more change to vote for it.
The Senate Democrats, in particular Sen. Rachel Zenzinger, complained that they were willing to compromise but that the Republicans had rejected such efforts. In fact, the final bill represented serious compromise from the Republican desiderata going in.
Will Becker and her co-sponsor Rep. Dan Pabon (D) be able to corral enough House Democrats to avoid poison-pill amendments, and have Sens. Tate and Priola been clear and convincing about just what those red lines are? Should a weakened bill make it out of conference, will enough Senate Republicans vote against it to offset any pickup in Senate Democrats. Recall that in the Senate Finance Committee, Sen. Jahn actually voted to support two amendments by Sen. Lois Court (D-Not Math) that ended up being proposed again on the floor.
We’re far from done. Let’s just hope they’re not still marking up amendments the first week in May.
Sen. Dan Kagan Emerges as Defender of PERA
Posted by Joshua Sharf in Colorado Politics, PERA on March 26th, 2018
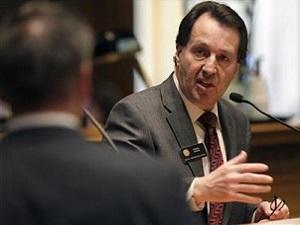
In Friday’s debate on SB200, the PERA reform bill, Sen. Daniel Kagan (D-Cherry Hills) emerged as the floor leader of those fighting to defend the current system. Neither his positions nor his prominence on this issue should entirely be a surprise to observers.
Kagan’s district isn’t particularly left-wing: it’s got a 32000 – 27000 Democrat-to-Republican registration advantage, but also has 35,000 Unaffiliated voters. Kagan won his race against Republican Nancy Doty 53% – 47% in 2016, running slightly behind Hillary Clinton, who got 56% of the three-way vote among herself, Donald Trump, and Libertarian Gary Johnson. Located in suburban Denver, it’s a battleground district, but because of its loction also has a lot of PERA members and retirees.
Kagan reliably votes the Democratic line and has since his time in State House of Representatives, but has a way of conducting himself with civility and generally respects even hostile witnesses who come before his committees. The plummy British accent born of a well-to-do aristocratic upbringing probably doesn’t hurt as a public face, either.
On Friday, Kagan proposed three separate amendments, all of which could well have been written by the unions. The first would have restored an increase in the employer contribution, a 1.5% increase as compared with the 2.0% increase that was amended out in the Finance Committee. He used the traditional phrases about “shared sacrifice,” but also noted that the SAED enacted in 2006 was supposed to come from money from foregone raises, claiming that the nominal current 20.15% overstates the actual employer contribution.
This is an argument rejected by both the governor’s office and even PERA itself, whose former executive director, the late Greg Smith, testified before committee that it was his impression that school boards around the state were eating the SAED themselves rather than taking it out of teacher pay.
Next, he moved an amendment to raise the COLA cap from 1.25% to 1.75%, although he didn’t speak to that amendment.
Finally, he proposed L-013, comprehensively different plan altogether. These sorts of amendments are called “strike-through” amendments because they strike-through the whole of the bill, seeking to replace it with something else. In this case, the “something else” would restore the employer contribution to 1.5%, lowered the increase in the employee contribution to 1.5%, capped the COLA at 1.75%, increased the Highest Average Salary calculation from 3 years to 5 years (as opposed to the 7 in the bill), rescinded the increase in the retirement age, kept the calculation on net pay rather than gross pay, and prevented the expansion of the DC plan availability to all employees.
He defended this proposal by arguing that the plan’s actuaries confirmed that, according to their assumptions, it would put PERA on a path to 100% funding in 30 years. He claimed that PERA was not in “crisis” as in 2010, but did lack “resiliency,” especially since the adoption of more “conservative” assumptions. The language here is important. The term that the PERA Board would use for its November 2016 revisions in the expected rate of return and mortality tables is “realistic,” but this is incorrect – they are more conservative, and still far too optimistic. It is those assumptions that the actuaries are operating under.
He also derided the expanded DC plan availability as a “poisoned chalice,” that most PERA members rejected in favor of the shared responsibility and pooled resources of a DB plan that would always be there for people. I think it should be obvious to all but the most blind observer that the experience of the last 20 years shows that, absent continual adjustments, benefit cuts, and increased taxpayer contributions, the DB plan will not “always be there.”
Debate on this amendment – backed by the unions – will continue Monday morning when the Senate reconvenes.
SB200 and PERA Reform – The Good, The Bad, and The Missing
Posted by Joshua Sharf in PERA on March 23rd, 2018
Today, the State Senate is scheduled to debate SB18-200, the PERA reform bill, on the floor. As befits a big, complicated problem, it’s a big, complicated bill. As with any big, complicated bill it’s a mix of good and bad. In this case, there are also elements that are missing that would vastly improve the bill’s effectiveness and fairness.
And as with any bill, especially one in a divided legislature, there are political considerations. The bill is the result of several months of bipartisan effort, led by Republican Sen. Jack Tate and Democratic Rep. K.C. Becker, but also with the contributions of several Democratic senators and Republican representatives.
The Good

Photo Credit: Todd Shepherd
The Good in SB200 can be broken down into three parts. First, there’s the usual dial-turning and knob-twisting, but in this case, there’s also some screw-tightening and refitting. Second, there will be expanded legislative oversight. Third, there will be an expansion of the Defined Contribution plan. Let’s take each of these in turn.
The Dials and Knobs
The bill will increase contributions and decrease benefits in a number of ways:
- Employee contributions will step up another 3%
- Contributions will be calculated on gross, rather than net salary, reducing the incentive to game the system through deductions and spiking
- The Highest Average Salary will be calculated on 7 years, rather than the current 3 years
- COLAs will take a 2-year break, and then will max out at 1.25% per year
- The retirement age will increase to 65 for new and younger employees
- If needed to keep the plan on track, employee contributions and COLAs will be adjusted automatically
The retirement age increase and the COLA limits have been the main targets of PERA members, for obvious reasons. COLA limitations put almost all the inflation risk on retirees. Adjusting the retirement age for new employees is relatively uncontroversial – there is no group less organized than those who have not yet decided to sign an employment contract. But adjusting the retirement age for existing employees, even younger employees who have time to adjust, will have to be tested in the courts to see whether that’s considered enough of a “core” benefit to resist change.
Increased Oversight
The bill also calls for the creation of a new joint legislative committee, composed of six House and six Senate members, three from each of the caucuses, specifically to oversee PERA. The committee would also have four non-voting outside experts appointed by the Treasurer. Creation of this committee would create an in-house body of expertise, much like we have with the Joint Budget Committee, and which is lacking the legislature now. It would also allow outside experts to grill the Board publicly and hold it accountable – at least in words – for the effects of its decisions and recommendations.
Defined Contribution
Currently, State employees – but not teachers or other PERA members – have the option to choose the Defined Contribution plan when they join PERA. This bill would extend that option to all new PERA members, and it is one of the most reviled parts of the bill as far as PERA and the unions are concerned. They believe that it will work to undermine the DB plan, but they say that as though it were a bad thing.
The Bad
The bad was the increase in the employer (read: taxpayer) contribution. The original bill would have increased that by 2%, when employers are already putting in 20.15% of salary. For school districts who are already paying upwards of 1/8 of their operating expenses into PERA, this would tighten budgets even further. Small governments and municipalities would also be looking a 23-25% of salary going into PERA. Fortunately, this was amended out of the bill in the Finance Committee on a party-line vote.
So, if there’s only good, and not much bad, why isn’t the Independence Institute full-throatedly behind the bill? Because of…
The Missing
We believe that, as it stands, the bill can do some good, but represents a potentially substantial missed opportunity to do more to solve the problem over the long term.
Obviously, our preferred DC/DB mix would be to get rid of the DB option for all new employees to keep from perpetuating the problem into the future. That would still leave the unfunded liability of $50 billion to be dealt with. We would also like to see an option for current PERA members to change their choice and go to the DC plan. This could be done in a cost-neutral way, where members only take their own contributions and the actuarial value of their vested benefits with them, and PERA would be able to set the price.
Barring that, we would have preferred an entirely new, more conservative DB plan with no employee contribution above the normal cost, and separate accounting for employer contributions going to the normal cost and the unfunded liability.
The bill implements neither of those. At a minimum, therefore, the defined contribution should be the default option, rather than the defined benefit. In the first place, the default option tends to be “sticky,” meaning that people tend to stick with what they’re put into as a default. Leaving the DB as the default will tend to minimize DC participation. That leads to a potential political problem down the road, where low DC participation is cited as a reason to yank the option altogether.
Second, the new oversight committee is the minimum of governance reform. But it isn’t Board reform, nor does it prevent the Board from using public money to lobby the legislature for or (mostly) against additional proposed reforms. Allowing the Board to lobby against additional reforms raises the stakes for this bill, which is bad, but also increases the likelihood that we’ll end up back in the same place in a few years.
Last, PERA needs to take some accounting measures to keep itself on track. Namely, it should seek more outside advice than just its actuaries when estimating its expected rate of return. It should ask multiple investment firms to provide estimates of how well its current portfolio will do. It should also decouple its discount rate from its rate of return, using something like the Muni 20 Index. It will only do these things if required by law. For those who dismiss these requirements as details, we should remember that the current crisis was initiated when PERA lowered its expected rate of return from 7.5% to 7.25%. And for the knobs and dials to mean anything, the discount rate and rate of return need to reflect reality as well as they can.
We doubt that if a fix is passed, there will be any appetite in the short-term to pass additional reforms. PERA and its allies will reprise their call to let the current reforms work, as their did with SB-1 for the last 7 years. This bill is the chance to get things right, so let’s do that.
UPDATE: The Senate fought back floor amendments to raise the COLA cap and to restore the employer contribution. When the Senate adjourned, it was considering a “strike-through” from Sen. Kagan that would have replaced the proposed reform plan with one essentially written by the unions. That amendment would restore the employer contributions, raise the COLA cap, lower the employee contribution increase, retain the current retirement age, and eliminate the DC expansion. It will resume consideration of the bill and the amendment on Monday.
While it is likely that this amendment, along with all others to weaken the bill, will fail in the Senate, they also provide a preview of amendments that will be offered in the House, both in the Finance Committee and on the floor. Whether those amendments pass and force the bill to a Conference Committee will be the result of the efforts to defend against them by Reps. Pabon and Becker, and the level of commitment by Speaker Crisanta Duran to the bill’s integrity.
PERA Forum
Posted by Joshua Sharf in PERA on January 10th, 2018
On December 20th of last year, the South Metro Denver Chamber of Commerce hosted a forum on the future of Colorado’s deeply troubled public pensions, the Public Employees Retirement Association, or PERA.
PERA’s been in trouble for a while, but it only noticed how much trouble it was in late in 2016 when it adopted new mortality tables an a slightly less unrealistic estimate of its long-term rate of return. Since then, it’s been frantically trying to salvage the current defined benefit plan. PERA has a legislative proposal to tighten up COLAs, slightly increase the retirement age, increase contributions, and tighten up some loopholes in the benefit calculation formula. Governor Hickenlooper has released a plan of his own, similar to PERA’s with a few tweaks.
Independence Institute and I think the long-term solution needs to be more sweeping – a cutoff of the traditional pension plan for new members, and even providing the option for existing members to transfer into a new, 401(k)-style defined contribution plan. This won’t get rid of the massive, $80 billion unfunded liability, but it will keep it from getting any worse, and it will take the investment risk off the shoulders of the rest of the state and put it where it belongs, on the shoulders of the employees themselves.
The panel featured PERA’s interim Executive Direction Ron Baker, Amy Slothower representing the pro-reform Secure Futures Colorado, and Lynnea Hansen of the pro-PERA Secure PERA lobbying group, and me. It was moderated by State Senator Jack Tate (R-Arapahoe).
Here’s the audio from the event:
As you can see, things got most heated around the discussion of the composition and responsibilities of PERA’s Board of Trustees. Ron claimed the PERA’s Board was responsible for managing the money and administering the plan. That’s true, but as I point out, it’s far too modest. PERA’s Board also lobbies the legislature, posing as a disinterested unbiased source of information, but in fact opposing almost all interim reform proposals, including some that are now part of its proposed slate of reforms.
PERA and the 30-Year Amortization
Posted by Joshua Sharf in PERA on October 25th, 2017
In its campaign to sell its proposed reforms the PERA board has taken to emphasizing that the 30-year amortization period is written into Colorado statute. Per C.R.S. 24-51-211:
(1) An amortization period for each of the state division, school division, local government division, judicial division, and Denver public schools division trust funds shall be calculated separately. A maximum amortization period of thirty years shall be deemed actuarially sound. Upon recommendation of the board, and with the advice of the actuary, the employer or member contribution rates for the plan may be adjusted by the general assembly when indicated by actuarial experience.
Not only did they mention this at the Aurora tour stop last week, they tweeted it out last night.
The less rigorous standard means they never actually have to achieve full funding. PERA’s appeal to the authority of the law in this case rings hollow.
It’s the industry standard for public pensions, which is why it was written into the law in the first place. Presumably, if the industry standard were to change, the statute would change as well. Legislators aren’t experts in this material; they were clearly relying on the recommendations of the public pension stewards at the time. In effect, PERA is appealing to its own authority in this matter.
The fact is, industry standards for public pensions haven’t saved the industry from its problems. Not so long ago, the industry standard was a rate of return well over 8%. Right after SB1 was implements, PERA’ amortization periods all dropped under 30 years. That lasted all of one year.
The choice of a target amortization period should be based on whether or not it makes sense, not on appeals to authority that have proven less than authoritative over the years.
Photo Credit: Todd Shepherd
Why PERA’s Cumulative Returns Matter
Posted by Joshua Sharf in PERA on March 9th, 2017
PERA’s unfunded liability often comes into sharper after a year of low returns. Its detractors point to last year’s 1.5% return, for instance, as evidence that PERA’s expected rate of return is too optimistic (it is). Its defenders argue that a single year’s returns are less important than the long-term (they are). They then point to a time frame, say, the last 7 years, where PERA has averaged 9.7%.
But it’s not just average returns that matter. It’s cumulative returns, and there, even a couple of bad years can wreak havoc on a defined benefit plan.
Let’s look at PERA’s returns since 1990:

A few really bad years to start off the century, and we all remember 2008. But aside from that, mostly above expected, and a few years slightly below expected. If you had invested $100 in PERA Mutual Fund in 1990 and let it sit for a quarter century, you’d be about where you should be, based on each year’s expected rate of return. Most years, you’re even ahead of the game, before the dot-com burst and the housing bubble burst bring you back to earth.

But of course, you don’t put $100 in in 1990 and let it sit. You put $100 in every year. Instead of looking at this from the perspective of each year going forward, let’s choose the perspective of 2015 looking back at each year. That is, for each year where you’ve invested $100, let’s see how you end up in 2015.

For $100 invested in 1990, you’d expect to have about $800, and we already know that that’s what you’ve got. For $100 invested in 2000, though, you’d expect that to be worth $355 today, but it’s only appreciated to $228. That’s because in January 2000, you invested before the bad years of 2000-2002. So money invested in every year from 1995-2003 is worth less now than PERA’s expected return would project. In fact, there are only a few years where the cumulative return through 2015 is better than expected, because 2000-2002 and 2008 wipe out all the gains beyond expectations.
Not surprisingly, this means that your PERA Mutual Fund is short of expectations in 2015, by just over 9%. You’d expect to have just over $9000, but instead you’re just under $8200.
Naturally, PERA’s actual situation is much more complex than this. But the point remains – it’s not enough to do as well as you’d expect over a long period of time, even in the absence of required annual payouts. In order to keep the plan solvent, you need to do better than that.
PERA Admits Problem – Blames Legislature
Posted by Joshua Sharf in PERA on January 4th, 2017
 Could people be catching on to the shell game / ponzi scheme that is Colorado’s public pension system? If the Denver Post can start running critical articles, then anything’s possible.
Yesterday (“‘Alarm bells’ raised: PERA stability again under scrutiny“), the Post noted that even PERA is admitting that it’s going to take longer to reach fully-funded status than had been previously estimated.
Wow! Who could have predicted this? It’s a shame nobody’s been around to tell them this might happen.
PERA is paying particular attention to the Judicial Fund, which is projected never to crash and burn, but never to achieve fully-funded status. It’s like a pension version of Purgatorio. We’ve been here before with larger funds, and indeed, the Denver Public Schools Fund also has an infinite amortization period.
The Judicial Fund is tiny. The DPS fund isn’t huge itself. The state could easily just pay these pensions out of current cash.
The State and School Funds, however, are gigantic by comparison, and have the potential to crush state and school budgets. Their amortization periods are now around 45 years, and headed in the wrong direction. The amortization period varies wildly with relatively small shifts in return because we’re operating so close to the margin. It’s not the 10 year shift itself that’s worrisome, it’s the fact that we’re so close to infinity to begin with.
PERA with good amortization. A small difference in the funded level doesn’t change the date much. This is ok, as long as you don’t drift too far off center.

PERA with bad amortization. A small difference in returns sends you first to the brink, and then spinning off into space, helpless, never able to retire. You just don’t want to be operating in this region.

PERA, like most public pensions, relies on “time diversification,” or the idea that over the long term, average expected returns are the best guide to what will happen. But they’re not the best guide to what the risk is to the fund, the retirees, and the citizens of the state. The paradox is that even as average returns converge, where you end up at the end of 30 or 40 years spreads out.
It’s like the pension version of “gas expands to fill the available space.” Imagine if I brought a canister of chlorine gas into the room and took the top off of it. Sure, the center point would stay the same, but pretty quickly we’d be all DIA murals.
In the same way, the expected returns converge to the mean, but the number of things that can happen, the number of different balances you can end up with, grows, and therefore so does the risk of one of those balances being negative.
PERA itself has acknowledged this. Its own study in 2015 showed a better than 1-in-6 chance that the School and State Funds would crash and burn sometime in the next 30 years, based solely on variations in expected returns:

When PERA runs into trouble, it will likely be because of low investment returns. The state will then likely try to come to the taxpayers to bail it out. It may even be forced to do so by the courts.,
The problem is, the taxpayers have their retirement money in mostly the same places of PERA, and will have also been seeing low returns on their own retirement portfolios. Basically, the state will be demanding money from people who don’t have it, in order to honor promises they didn’t make.
As a taxpayer, I’m mad. But I’d also be mad if I were in the legislature. Here’s PERA Executive Director Greg Smith:
“You all put together a 30-year plan to recover from that,” Smith told lawmakers. “We’re six years in, and we’re behind. And we’re going to go and talk about how can we get back on track for what that plan was.”
“You all?” Yes, that’s true. The Legislature had to vote on the plan. But it was informed by PERA’s Board, who not only backed SB1, but also had a huge part in drafting it and commenting on its provisions. Every year, every time the question has come up, PERA’s Smith has said that things were just fine. Every time anyone proposed changes to make it more robust – better reporting, small tinkering at the edges, larger more substantive improvements – PERA’s Smith has been there with his merry band of union and retiree groups arguing against them.
This is Exhibit A of why we need to move to a defined contribution plan and take these decisions out of the hands of elected officials. Legislators aren’t (all) dumb, but they’re not specialists, and they rely on experts like Smith to inform them about what needs to be done. But Smith and PERA as a whole have a vested interest in telling them that everything is fine, or that more money from taxpayers will fix the problem.
Moving to a 401(k)-style plan, or even a cash balance plan, would help insulate everyone from the politics here.
Podcast Experiment
Posted by Joshua Sharf in PERA, Radio, Stacy Petty Show on September 30th, 2015
 One of my fondest desires has been to produce a This American Life or RadioLab, only for free-market and conservative ideas. Thanks to Stacy Petty, I’ve actually been given a chance to do this.
In one of his own podcast interviews, Dan Carlin of Hardcore History fame says that his goal has been to produce, for radio, a long-form edition of what a newspaper column would look like. That’s kind of what I’m aiming for here, as well. Edited, polished, but also using the illustrative and mood-setting background sound that radio give you, but newspapers don’t.
It’s unclear exactly what the format will be going forward, but here’s the first attempt, discussing PERA, the forthcoming State Auditor’s report on an early warning system, and small planes. It runs 10:30, but I’m hoping to bring future editions in at exactly 10:00.
Podcast: Play in new window | Download
As Colorado’s Pensions Add Risk, California Seeks to Reduce It
Posted by Joshua Sharf in PERA on July 26th, 2015
 Even as Colorado’s state public pensions seek to add risk to their portfolio, California CalPERS is seeking to reduce risk and volatility in its own plan. In doing so, it sends up a flare for other pension plans. It also confirms one of the key assertions of defined benefit plan critics: the aggressive return assumptions, combined with permissive discount rate assertions, in US public pension plans incentivize those plans to chase those returns, and add risk in doing so.
In a piece I wrote back in March for Watchdog Arena, I noted that Colorado PERA’s Board of Trustees had voted to shift several percentage points of investment from stocks and bonds into riskier alternative assets and real estate. This portfolio isn’t necessarily out of line with the majority of US public pension asset allocations, but it does represent adding risk – and therefore volatility – in an attempt to increase returns.
Yesterday, Pensions and Investments reported that CalPERS is looking at reducing its expected 7.5% rate of return to as low as 6.5%. Doing so, the plan says, would allow it to shift its investments out of stocks and alternative assets into more predictable, less volatile bonds.
“It is essential that we do this,” said California Controller Betty T. Yee in an interview with P&I. Ms. Yee added that if CalPERS does not reduce volatility, it could jeopardize its ability to pay retirees in the future….
Ms. Eason said lowering the rate of return would also enable officials to build a portfolio less vulnerable to market swings. The current 7.5% rate of return has a 12% volatility rate. Reducing the rate to 7%, as one scenario does, would translate to a 10% volatility rate. A 6.5% rate of return would equate to a volatility level of 8.5%, she said.
In doing so, CalPERS doesn’t implicitly accept the critics’ assertions – it explicitly accepts them. They would lower the expected rate of return specifically so they could “safely” move assets into less risky (albeit less remunerative) investments. Public pension officials in the US have long denied a linkage between the two, so it will be interesting to see how they react to this admission.
By most measures, CalPERS is better funded that Colorado PERA, although not particularly well-funded. It admits to a funding level of 77%, compared to PERA’s claimed funding level of 62%. These claims both discount the pension liabilities at 7.5%, the assumed rate of return. Lowering CalPERS’s expected rate of return to 6.5% would, correspondingly, lower its funded level by lowering its discount rate. A study by State Budget Solutions, however, using the states’ cost of borrowing as the discount rate, placed the funding levels at 39% and 32%, respectively.
PERA’s 2014 CAFR – Situation Normal…
Posted by Joshua Sharf in PERA on June 23rd, 2015
Colorado PERA released its 2014 Comprehensive Annual Financial Report on Tuesday, and there were no real surprises, which isn’t to say it was particularly good news for the state’s retirees, government employees, or taxpayers. For the most part, it showed more of what we already knew: a system in trouble, and unlikely to earn its way out of that trouble any time soon, if ever.
The rate of return on investment was 5.7%, which is 1.8% short of the expected rate of return of 7.5%. PERA will no doubt point to the fact that it met the benchmark return, but all that means is that the funds weren’t grossly mismanaged. The net result is that the unfunded liability, as acknowledged by PERA, climbed from $23.3 billion to $24.6 billion.
In reality, the future liability should be discounted not at the expected rate of return – an accounting gimmick that is only available to US public pensions – but by the borrowing cost of the governments involved. In this case, that would mean a discount rate of about 4.5%. Running that out 15 years, we end up with an eye-popping unfunded liability of $60 billion. A 30-year window raises it to an almost unimaginable $116 billion. That’s the unfunded liability – the promises made for which we have no money.
Overall, the funding levels fell to 64.2% from 65.2%, but the two biggest funds are much worse off than that. The State Fund’s funding level slipped to 59.8%, the School Fund to 62.8%. These calculations are done using the market value of the assets, rather than the smoothed actuarial value, as they have in the past. That actually makes the funding levels look better, as the investments age out the miserable 2011 investment year, but it gets the direction right, and funds can only spend and invest actual dollars, not smoothed ones.
The amortization periods – how long it would take to get to full funding – also ballooned to 45 years for the State Fund, and 48 years for the School fund, after accounting for the future increases in the AED and SAED supplemental payments. PERA rightly points out that these numbers don’t account for the decrease in benefits for future hires, which probably shorten the amortization periods by a few years.
I’ll have a lot more to say about this, but the short version is that there’s nothing to be cheerful about here. PERA will claim that everything is still on track to be fully-funded decades hence, but then, PERA always thinks nothing’s wrong right up until the point that they come to the legislature for more money.
Photo Credit: Todd Shepherd & Complete Colorado
-
You are currently browsing the archives for the PERA category.


