PERA’s problems don’t stop with the state. While the Colorado government has consistently shorted PERA on its Annual Contribution (theoretical) Requirement, local school districts have less flexibility in kicking the can down the road. As a result, their PERA contributions have increased rapidly, in some cases very rapidly, over the last decade or so. Here are the compound annual growth rates for four of the largest school districts from 2003 – 2011 (except for Cherry Creek, for which data was only available starting in 2006).

These numbers include all PERA contributions, both to the School Trust Fund and to the Health Care Trust Fund HCTF).
What does this mean for school budgets? Well, taking the Schedule 4 disclosures in the Statistical sections, we can derive the annual operating expenditures. For the government funds, we take the total expenses, subtract out the CapEx and the Debt Service, and then divide that number into the annual PERA contribution (described three years rolling in the Financial Section Notes).
The result? Not pretty:
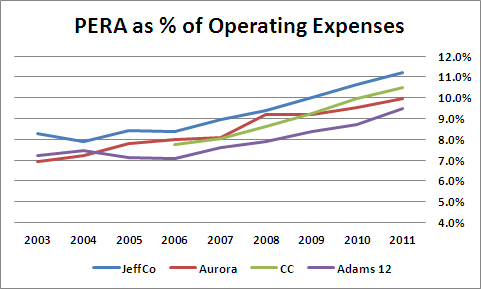
The role of debt service in school finance is another matter well worth examining, but in this case, adding it in would just alter the level, not the trend. But consider that in JeffCo, 1 in every 9 dollars goes to PERA. In Cherry Creek and Aurora, it’s 1 in 10 dollars.
It’s not that school spending isn’t rising. It’s that PERA contributions are skyrocketing. And school budgets are starting to feel the pressure.
UPDATE: A typo in the Cherry Creek numbers prior to 2009 exaggerated the rate of increase, and created a “knee” in the data between 2008 and 2009. The 2006-2008 contributions were actually higher than I had reported. I’ve corrected the charts.


