Posts Tagged Debt
Denver Schools Back For More
Posted by Joshua Sharf in Colorado Politics, Denver, Taxes on September 20th, 2012
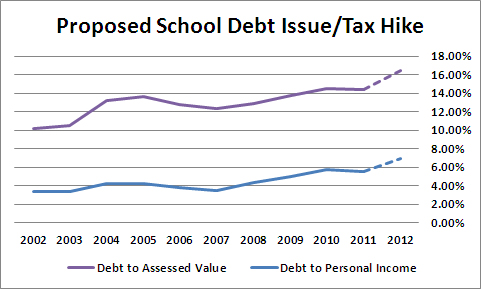
Whenever the schools teachers unions come back for more, they always want you to forget how much they’ve taken in the past. This year, Denver Public School are proposing both a tax hike, and a debt issue. We’ll look at the tax hike another day. What many people don’t realize is that DPS has been borrowing like they had the Fed at the other end of the line (which they sort of did). Over the last 10 years, the bonded debt per capita has almost doubled, and the proposed $466 million increase would, I estimate, raise it almost another $700 per person.

That alone doesn’t tell us much, though, about our ability to pay this debt. The debt is funded through a mill levy on personal property, and is therefore limited based on the total assessed property value in the district.
So to consider how affordable and wise additional debt is, we should look at the ratio of Debt/Assessed Value – in effect, how mortgaged is your property for this debt?
But unless someone annually rolls their property tax into their mortgage, though, they have to pay it out of current income or savings. Which means that it’s also important to consider the debt as a percentage of total personal income. The charts below show how those ratios have risen over the last ten years, with the dashed line estimating how the additional $466 million would increase these ratios:

Both ratios have risen, and would rise dramatically on passage of 3B. Note, though, that the burden on income is rising faster as a percentage basis (vs itself) than the burden on assessed value. The property tax is a regressive tax. While it’s nominally paid by the property owner, they really pass it on their renters, so the burden rests on the entire city. This chart shows that while the debt burden for the school district has been rising as a function of assessed value, it’s been rising even faster in terms of people’s ability to pay.
The DPS and the CEA will always argue that they need the marginal increase. What they won’t tell you is how these marginal increases add up over time.
Note on data sources: The Denver Public Schools, like all Colorado Public School districts, is required to file a Comprehensive Annual Finance Report. It gives the Net Debt for the school district, and also calculates the per capita, and the other ratios. But it only had that data through 2008. While the BEA calculates total personal income at the county level, its latest data was for 2010. The BLS publishes a total wages number at the county level, though, and had numbers through 2011. The ratio of the DPS’s reported total personal income for the county to the BEA number was 1.24, with a standard deviation of 0.02, so I decided to use the BEA numbers multiplied by 1.24 for 2002-2011. With current reports showing wages in Denver declining slightly, and employment static, I plugged in the 2011 number for 2012.
For the 2012 Assessed Valuation, I used the 2011 Assessed Valuation plus 10%, which is about what the Case-Schiller is showing for the Denver area.
For population, I used the official Census estimates for Denver, and then added 16,000 to the 2011 estimate for 2012. These differ somewhat from the population numbers used by DPS.
For the total debt, I simply added the $466 million requested to the latest 2011 Net Debt reported by DPS.
Greek Tragedy Headed For a Finnish?
Posted by Joshua Sharf in Economics, PPC on August 24th, 2011
Remember the first guy in line at that beautiful ol’ Bailey Building and Loan? The guy who wants every last penny of his account out, so he can put it under his mattress?
Well, George Bailey is Greece and that guy is Finland.
The Finns, as a condition of a loaning Greece more money, wants hard collateral, and the Greeks were perfectly willing to cut this side-deal, to the chagrin of the Dutch, the Austrians, and a host of other lending countries who are now expecting the same treatment.
The other Euro-lenders need to approve any Finnish collateral, and they don’t seem in a mood to do so, which the Finnish government surely had to have known when it struck the deal. There’s at least some evidence that it was reached more for internal Finnish political consumption than anything else.
Now, it’s not entirely clear what form the collateral can take. More Greek debt is probably not going to cut it, so whether it’s buildings or islands or the new Ferrari or ticket revenue at the Parthenon or on option on the Elgin Marbles upon their prospective return, we don’t really know what the Finns thought they were getting as collateral. If it turns out to be some dedicated revenue stream, they’ve turned themselves into tax farmers for the Finns, and made the Finns the senior debtholders.
That’s what the rest of the European lenders are worried about. They’re worried that once the Finns get paid off, there won’t be enough to go around for the rest of them, so some of the other countries are refusing to sign off on that deal unless they also get, ah, assurances.
With the added doubt about Europe being able to arrive at a deal, Greek-German spreads have jumped up today. But as with the US debt ceiling debate, the liquidity problem pales in comparison to the solvency problem. The fact that the Dutch, Austrians, Germans, and Slovians (Slovakia and Slovenia) are all against it isn’t just a signal that they don’t want Finland rocking the boat. Isn’t it also an indication that they money isn’t there? Not just today, but for the duration of the restructure?
At this point, the complaints seem to be more along the lines of fairness rather than structural soundness of the loan. The one exception is the Austrians, who proposed an inverse relationship between loan and collateral. But even then, reassuring the small countries that they’ll get theirs, while the large countries recognize implicitly that they’re not any better off with guarantees, isn’t exactly reassuring.
Nevertheless, the reaction is telling. Right now, George Bailey is asking that nice old lady how much she can get along with, and praying that she doesn’t just name her account balance.
A Transfer on the Road to Serfdom
Posted by Joshua Sharf in Business, Economics, PPC on August 3rd, 2011
As an emblem of what Walter Russell Mead calls, “the Blue Social Model,” there’s almost no place Bluer than New York. So it seems fitting to pay homage to the home of the modern patronage state in a post devoted to transfer payments.
We all know that transfer payments – Welfare, Social Security, Medicare, Medicaid, Unemployment Benefits – have been growing at an unsustainable pace, and are the source of our long-term structural problems. We’re also aware that once a program acquires a sufficient constituency, it’s almost impossible to reduce, let alone do away with. Thus the concern when the top few percent of earners pay 40% of all income tax, and when half the country pays no income tax at all.
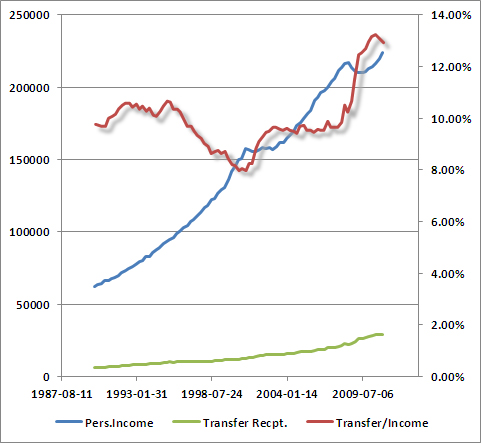
This dramatic Calculated Risk post about recession measures has gotten a number of people’s attention, but what struck me was the qualifier on the Personal Income chart: less transfer receipts. Transfer receipts don’t count towards GDP, with good reason, but they certainly subtract from the country’s capital available for investment or spending. They’re also the key, most public, most obvious way of obtaining a constituency for higher taxes and continued spending. We’re now reaching the point where almost $1 out of every $5 of personal income comes from transfer payments (the scale on the left is in $ billions):

You can see the large boost given as Medicare and Medicaid took hold in the late 60s and early half of the 70s. Through the 80s and 90s, the numbers continued to slope upwards, but a robust economy kept them largely between 12% and 14%, or between 1/7 and 1/8 of personal income. Then, with the financial crisis and the preceding recession, they went through the roof. For the first time, a boost in transfer payments was also accompanied by a year-over-year drop in aggregate personal income. It’s that spending percentage that Obama and the Democrats want to lock in as the floor for the economy.
Colorado has it a little better, or maybe is just lagging behind the rest of the country (the scale on the left is in $ millions) :

In the 90s, as Colorado recovered from the commodities bust and attractive tech talent from around the country, the percentage of income derived from transfer payments fell just barely above 8%. The recession of the early ’00s hit, and the slower growth of that decade, while real, was only enough to just balance the increase in transfers. Some of this was a result of Colorado’s generosity to its own citizens, as the legislature loosened rules for Medicaid. The state, of course, followed the rest of the country in a near-vertical climb in ’09.
The number is starting to decline gently as unemployment benefits run out, and incomes begin to slowly recover.
The chart, although the time scale is different from the one for the country as a whole, points out the main lesson of all this: growth is the only way out of this problem. It can’t be healthy for $13 of every $100 of personal income to come from an unearned government check. It’s even worse for the country as a whole. And the deepening dependency of more and more people is only going to make the political will necessary to break this cycle harder to find.
One More Thought on the BBA
Posted by Joshua Sharf in PPC, President 2012 on July 29th, 2011
There are a couple of ways that, skillfully used, the BBA could actually end up helping the Republicans, at least in this first round.
First, it’s a bargaining chip. If the owners can give up an 18-game season that the players were never going to play, the Republicans may be willing to settle for a BBA vote (as opposed to passage), forcing the Dems to re-assert their Big Government bona fides.
More interestingly, if Boehner 2.1 (Boehner 2.0 with the BBA upgrade) passes the House with Democrat support, as seems likely, it’s going to make it harder for them to go back on that when it actually comes time to vote on the BBA. And if it gets stripped out in the Senate, you may end up with the spectacle of House Dems, having vote against 2.0, and then for 2.1, having to turn around and vote for 2.0 when it comes back around.
Regardless, the Republicans need to hold firm on the smaller cap increase number. The benefit of having this debate again – and possibly yet again – before the election, both political and policy-wise, are too integral to the overall strategy to roll over on.
Obama’s Evergreen Goes Brown
Posted by Joshua Sharf in 2012 Presidential Race, Business, Economics, Finance, National Politics, PPC on July 28th, 2011
Barack Obama and Harry Reid may not be able to produce a spending plan, but at least they have their old campaign talking points from 2008 to fall back on.
With the Senate having failed to produce a budget in over 2 years, the President’s budget having succeeded in uniting Washington to a degree not seen since it was under threat of attack 150 years ago, and neither willing to commit a spending plan to paper, they can be relied on to Blame Bush!
The White House has put out a graphic purporting to show that – surprise! – 8 years under President Bush added more to the national debt than 2 years under President Obama. (They play with the numbers, by assuming that the cut in marginal tax rates didn’t stimulate growth, for instance.) That President Bush wasn’t exactly a fiscal conservative like FDR isn’t a secret to anyone. In its day, what was seen as recklessness spawned Porkbusters, the Tea Party in embryo.
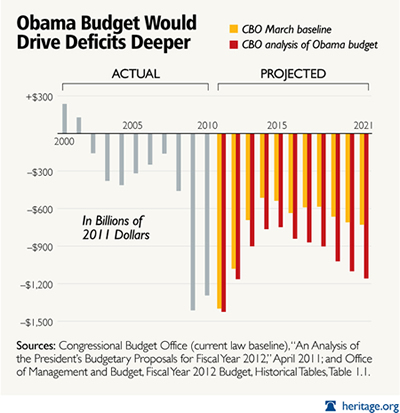
But let me remind you of this chart, originally in the Washington Post:

It’s been updated by the Heritage Foundation:

Much as Babe Ruth redefined baseball by showing what could be done when you try to hit home runs, so has Obama redefined deficit spending by showing what happens when you really put your heart and soul into it. You’ll notice, by the way, that the latter graph compares the CBO to itself, rather than to the White House budget, because, haha, there isn’t a White House budget.
Note also how the color bars in each graph look the same, only they’re shifted to the right by two years in the update. It’s evident that 2010 and 2011 haven’t worked out as planned. It’s no wonder that Tea Partiers don’t really believe in out-year cuts; the deficit reduction hasn’t occurred because Obama’s policies and those of Congressional Democrats have stifled economic growth, and because they’ve been happy to govern illegally, without a budget for two years, leaving federal spending essentially on auto-pilot.
The other argument you hear is that Paul Ryan’s budget made use of the same accounting trick that Harry Reid’s budget-avoidance bill does: counting savings from the Iraq and Afghanistan wars we won’t be fighting. But Ryan’s plan was an actual budget. There were always holes, but the difference between “will spend” and “would have spent” means a lot less when you’re drafting an actual plan, than the difference between “will spend” and “will take in.” Ryan applied that $1,000,000,000,000 to a headline.
Reid proposes to let the President spend it between now and Election Day 2012.
The Democrats won’t produce a budget because they can’t, only they don’t want you to know that until after the election. So much for them.
The Tea Party folks have a different complaint, namely that Boehner’s Plan doesn’t go far enough. I’d like to see more cuts, too. But the idea, as I recall, was to use the debt ceiling deadline as a means for forcing a debate, forcing changes to the spending that is current and planned. It was never realistic to run the entire federal government out of the House of Representatives.
To that extent, the plan has been wildly successful. It has exposed the Democrats as dangerously delusional about the state of our finances, whose only current idea is to soak you to ratify a massive increase in the scope of our economy directly controlled by the government. The Boehner Plan re-adjusts the baseline, keeps the debate on the front burner pretty much through the election, and does it without raising taxes. These are major victories, and they would not have been possible without the Tea Party. Period.
That said, this particular fight is one of many. Pushing too hard right now, bringing on a technical default, or, more likely, putting incredible discretionary power in the hands of a teenage president, won’t be Sherman marching through Georgia, it’ll be Napoleon marching to Moscow.
There is considerable frustration abroad that we can’t simply win this thing already. But politics isn’t about that. Regardless, we’ll have to keep watching, pushing, and prodding. There aren’t any final victories in politics, either over the other party or within your own. The best use of this battle is to pocket the gains, and use the process to help prepare the battlefield for the next fight.


