Whenever the schools teachers unions come back for more, they always want you to forget how much they’ve taken in the past. This year, Denver Public School are proposing both a tax hike, and a debt issue. We’ll look at the tax hike another day. What many people don’t realize is that DPS has been borrowing like they had the Fed at the other end of the line (which they sort of did). Over the last 10 years, the bonded debt per capita has almost doubled, and the proposed $466 million increase would, I estimate, raise it almost another $700 per person.

That alone doesn’t tell us much, though, about our ability to pay this debt. The debt is funded through a mill levy on personal property, and is therefore limited based on the total assessed property value in the district.
So to consider how affordable and wise additional debt is, we should look at the ratio of Debt/Assessed Value – in effect, how mortgaged is your property for this debt?
But unless someone annually rolls their property tax into their mortgage, though, they have to pay it out of current income or savings. Which means that it’s also important to consider the debt as a percentage of total personal income. The charts below show how those ratios have risen over the last ten years, with the dashed line estimating how the additional $466 million would increase these ratios:
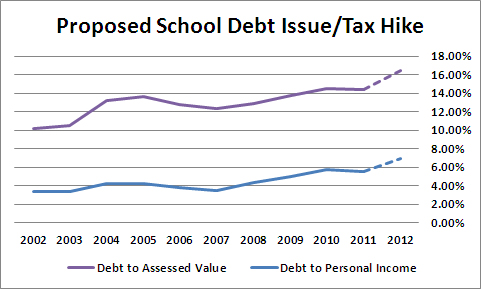
Both ratios have risen, and would rise dramatically on passage of 3B. Note, though, that the burden on income is rising faster as a percentage basis (vs itself) than the burden on assessed value. The property tax is a regressive tax. While it’s nominally paid by the property owner, they really pass it on their renters, so the burden rests on the entire city. This chart shows that while the debt burden for the school district has been rising as a function of assessed value, it’s been rising even faster in terms of people’s ability to pay.
The DPS and the CEA will always argue that they need the marginal increase. What they won’t tell you is how these marginal increases add up over time.
Note on data sources: The Denver Public Schools, like all Colorado Public School districts, is required to file a Comprehensive Annual Finance Report. It gives the Net Debt for the school district, and also calculates the per capita, and the other ratios. But it only had that data through 2008. While the BEA calculates total personal income at the county level, its latest data was for 2010. The BLS publishes a total wages number at the county level, though, and had numbers through 2011. The ratio of the DPS’s reported total personal income for the county to the BEA number was 1.24, with a standard deviation of 0.02, so I decided to use the BEA numbers multiplied by 1.24 for 2002-2011. With current reports showing wages in Denver declining slightly, and employment static, I plugged in the 2011 number for 2012.
For the 2012 Assessed Valuation, I used the 2011 Assessed Valuation plus 10%, which is about what the Case-Schiller is showing for the Denver area.
For population, I used the official Census estimates for Denver, and then added 16,000 to the 2011 estimate for 2012. These differ somewhat from the population numbers used by DPS.
For the total debt, I simply added the $466 million requested to the latest 2011 Net Debt reported by DPS.


