Bridges make great campaign backdrops, as President Obama tried to exploit the other week while introducing his jobs bill. Trumpeting the desperate shape of America’s bridges, Obama spoke in front of a bridge between John Boehner’s Ohio and Mitch McConnell’s Kentucky, (a bridge that, as was noted at the time, wouldn’t have been eligible for funding under his new spending spree). Listening to him – and to just about every other public-works-booster in the last 20 years – you’d think that it was only a matter of time, months perhaps, before we found ourselves trapped behind rivers and gorges, as our bridges collapsed into dust.
Not so.
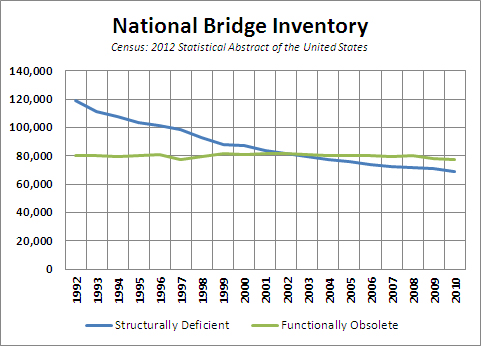
In fact, both as a percentage and in absolute terms, American bridges that are classified either Structurally Deficient or Functionally Obsolete has been falling for at least two decades. The percentage is aided by natural growth and new bridge-building. But that doesn’t account for the decline in absolute terms:

Over the last 19 years, we’ve added about 6% to our national bridge inventory, while the number of Obsolete bridges has declined by about 4% in absolute terms, and the number of Structurally Deficient bridges is down by over 40% in absolute terms:

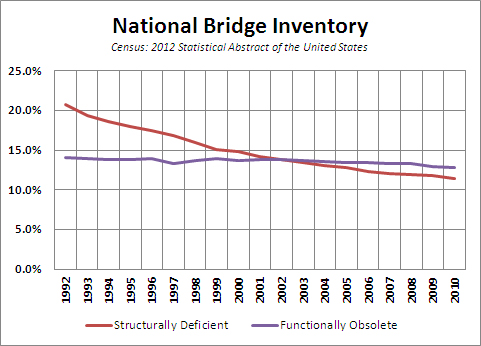
Structurally Deficient means that the bridge’s actual structure has deteriorated, or the bridge is on a working road and has had to be taken out of service. Functionally Obsolete means that the bridge is now too narrow or too low for the highway system that it’s a part of. And under the FHWA’s 10-Year Rule, no bridge that’s been built or upgraded or repaired to spec in the last 10 years is either Deficient or Obsolete. If a bridge is both Deficient and Obsolete, it’s only classified as Deficient. On a percentage basis, the achievement is even more striking:

The percentage of Structurally Deficient bridges has declined from over 20% to just over 11%, and the number and percentage of Obsolete bridges has declined, even as the national highway system has been continuously upgraded and extended.
In Colorado, the percentages are better than the national average, and have been since 1998 (the first year I could find state-level records). Currently, they stand at 7% Deficient and 10% Obsolete, even as the number of bridges has grown by 8% since 1998.
It might also help to look at the highway spending numbers over the last 20 years. I suspect that some of the increase in the late 90s’ Obsolete totals is a result of upgrading the surrounding road system, and that the decline in Obsolescence in the last 10 years represents a shifting of priorities, even as the number of bridges continues to climb.
Notably, what you don’t see is any massive improvement in the numbers from 2009 to 2010, the Year Of the Shovel-Ready Project. There’s a slight improvement, but nothing out of line with historical trends, which suggests that all that ARRA money wasn’t really going where it was advertised.
It’s possible, I suppose, that we’re coming up on the end of the useful life of some large number of bridges sometime in the new few years, but I doubt it. We’ve been growing the system and doing maintenance since the 1950s, and this Bridge and Highway crisis is one I’ve been hearing about as long as I can remember. Once one of these memes makes it into the public discourse, it seems it’s almost impossible to get rid of, no matter how much progress has been made.


