Archive for category Economics
Transportation Spending an Indicator?
Posted by Joshua Sharf in Business, Economics, PPC, Transportation on October 5th, 2011
Over at Carpe Diem (if you’re not reading it, you should), Mark Perry is arguing against a double-dip recession, suggesting instead that continued sluggish growth, the sort of grey sludge economy we’ve had for a while now, is the mostly likely scenario. One of his indicators is rail intermodal traffic, which set a volume record last week:

By itself, this doesn’t seem to be too strong an indicator. We’re just about at the seasonal high for the year, and year-over-year, the increase isn’t all that impressive. Also, when I spoke with the head of UP’s media relations a few months ago, he agreed that intermodal generally moves finished goods, and is an indicator of consumption, while non-intermodal carloads are raw materials, and thus a better proxy for production. They’ve barely moved. So both sides seem to confirm what the other numbers are showing.
But up is better than down, and some of the weakness may be capacity. Railroads seem to be moving to deal with that problem, and railcar manufacturers in Virginia and Arkansas are hiring new workers to meet the demand. Most of this is coming from lighter, stronger coal cars, as well as chemical and petroleum cars.
I’m contracting at a major trucker based in Omaha, and they’ve been reluctant to increase capacity for a couple of reasons, including general uncertainty. There’s a shortage of long-haul drivers, and already a capacity constraint, and yet they and at least one other mid-sized truck company I’ve spoken to are still not expanding their fleets.
However, they seem to be the exception. Transport Topics (behind a paywall) is reporting that Class 8 truck sales – which include all tractor-trailers – are the highest since early 2007. Some of this may be in anticipation of new rules that will force companies to have more trucks on the road to deliver the same amount of goods. To that extent – if at all – the additional purchases are an inefficient allocation of capital. But they aren’t likely the entire source of growth. Companies are already short of inventory and capacity, and are simply expanding to meet perceived demand.
In theory, all these increased orders for trucks and railcars should be predicting continued economic growth. In practice, we could still get blindsided by Europe, or it could be an example of companies expanding into a contraction, like a classic business cycle.
The Wyoming High-Flow Toilet Scam
Posted by Joshua Sharf in Business, Colorado Politics, Economics, PPC, Regulation on September 13th, 2011
Hat-Tip to Amy Oliver for this. According to the Denver Post, utility managers are pushing to outlaw at a state level that which is already outlawed at a federal level: your normal, regular, works-with-one-flush toilet. You wouldn’t actually have to trade it your working toilet for the hobbled version, but according to the proposed law, “manufacturers could not sell” regular toilets.
The water savings wouldn’t be trivial, but are mostly notional: two generations from now it could amount to enough for 88,000 families of four. What population and use numbers went into that estimate, the Post doesn’t say. Even now, that’s barely 5% of the population, when home water use accounts for less than half of total consumption. And while the article notes that Denver’s sewage system functions less efficiently with lower flow, the operating costs of that inefficiency (both monetary and aquiferous), and the capital expense required to mitigate, go unmentioned.
Aside from the article’s shoddy economics, there’s also the incentive system it sets up. There’s already quite a grey market in regular toilets from housing projects (friends of mine were careful to preserve theirs when they remodeled a few years ago), and this will only make it worse. The ban would apply to manufacturers, not individuals or remodelers, so no doubt, there will soon be calls to “close the Home-Fixtures Show Loophole.” And at least until the big boys move in, and add another layer of middle-men to the process, you’ll see wild-eyed dreamers thinking up schemes like this.
Infrastructure and Spending
Posted by Joshua Sharf in Business, Economics, PPC on September 6th, 2011
Word on the street is that President Obama will call for yet more “infrastructure” spending in his Wednesday Thursday night campaign speech address to Congress. Russ Roberts, of Econtalk, makes the effective rebuttal to this idea (as with most of the President’s ideas, it’s too amorphous to call it a “plan”) in two posts, “Crumbling“, and “Shovel Ready.” In Shovel Ready, he notes that Japan spent a decade spending money on “shovel ready” public works projects that provided little economic benefit above and beyond the circulation of currency for its own sake (or its own sake).
In Crumbling, he shows that we’ve been increasing the percentage of GDP spent on infrastructure for about three decades, and yet still hear complaints about “crumbling infrastructure.’ He then goes on to quote a New York Times column giving examples of waste here. One thing he doesn’t mention is that building pointless roads isn’t just a one-time expense – we’re stuck with the maintenance of those roads pretty much forever, lest they, too “crumble.”

Of course, this was before the most recent “stimulus,” and all those orange signs proclaiming spending throughout the land and to all the commutants thereof.
Taken as a whole, it’s a powerful argument against the sort of fire-hose spending “plan” that will likely be announced Thursday night.
I happen to believe that infrastructure is one of the proper areas for government spending, for a variety of reasons. How best to do that can be the subject of vigorous debate, but the story of the Kansas Turnpike shows the risks incurred when interstate projects aren’t attempted by an interstate authority. (For the moment, I’m happy to revisit the debates over political economy from the 1940s, but not the 1840s.)
All of this is what makes the first stimulus package such a shame. In the 1950s, we had the luxury of buying North Dakota’s support for I-95 with I-94. We could make a lot of mistakes, and still get the thing basically right. We don’t have that luxury now. Wasting almost $1,000,000,000,000 in “infrastructure” spending in 2009 doesn’t mean we get to go back and clean up the mess. It means we don’t have the money to do it right this time, so there is no this time.
A friend of mine likes to bemoan Americans who won’t spend on infrastructure, but it’s probably one of the few areas where the overwhelming majority of us actually do agree. And if the government weren’t so busy doing all the other things it shouldn’t be doing, it might actually have the attention and money to get this one right.
Lies, Damn Lies, and Infographics
Posted by Joshua Sharf in Business, Design, Economics, PPC on August 29th, 2011
This is what happens when people get outside their area of competence. FastCoDesign.com has its Infographic of the Day, and it can be a delight to behold.
But sometimes, like people who fell in love with the Obama “O,” they end up missing the flaws because they’ve fallen in love with the graphic design. The infographic on “Do Green Jobs Really Exist?” is a case in point, as the comments make clear. Here’s the graphic they like:

To his own surprise, Mr. Kuang concludes that Green Jobs not only exist, they’re pretty good jobs for middle-class workers, who don’t necessarily need advanced degrees.
But that was never in question. Of course, green jobs exist. But what the graphic doesn’t show is that while they’re well-paying, they’re also incredibly expensive and heavily subsidized, much moreso than oil and gas are, for instance. On a per-unit-of-energy produced basis, they’re even more expensive, which means they’re a massive misdirection of resources, sapping the vitality of other industries which could employ far more people for the same price.
What’s a little disturbing is that Kuang thought that the argument was about the existence of the jobs, rather than their price-to-value ratio. Admittedly, one data point is a thin reed on which to base a concern. But it does suggest that we need to do a better job articulating the Bastiat-Hazlitt concerns about subsidies if we’re going to win this argument.
Greek Tragedy Headed For a Finnish?
Posted by Joshua Sharf in Economics, PPC on August 24th, 2011
Remember the first guy in line at that beautiful ol’ Bailey Building and Loan? The guy who wants every last penny of his account out, so he can put it under his mattress?
Well, George Bailey is Greece and that guy is Finland.
The Finns, as a condition of a loaning Greece more money, wants hard collateral, and the Greeks were perfectly willing to cut this side-deal, to the chagrin of the Dutch, the Austrians, and a host of other lending countries who are now expecting the same treatment.
The other Euro-lenders need to approve any Finnish collateral, and they don’t seem in a mood to do so, which the Finnish government surely had to have known when it struck the deal. There’s at least some evidence that it was reached more for internal Finnish political consumption than anything else.
Now, it’s not entirely clear what form the collateral can take. More Greek debt is probably not going to cut it, so whether it’s buildings or islands or the new Ferrari or ticket revenue at the Parthenon or on option on the Elgin Marbles upon their prospective return, we don’t really know what the Finns thought they were getting as collateral. If it turns out to be some dedicated revenue stream, they’ve turned themselves into tax farmers for the Finns, and made the Finns the senior debtholders.
That’s what the rest of the European lenders are worried about. They’re worried that once the Finns get paid off, there won’t be enough to go around for the rest of them, so some of the other countries are refusing to sign off on that deal unless they also get, ah, assurances.
With the added doubt about Europe being able to arrive at a deal, Greek-German spreads have jumped up today. But as with the US debt ceiling debate, the liquidity problem pales in comparison to the solvency problem. The fact that the Dutch, Austrians, Germans, and Slovians (Slovakia and Slovenia) are all against it isn’t just a signal that they don’t want Finland rocking the boat. Isn’t it also an indication that they money isn’t there? Not just today, but for the duration of the restructure?
At this point, the complaints seem to be more along the lines of fairness rather than structural soundness of the loan. The one exception is the Austrians, who proposed an inverse relationship between loan and collateral. But even then, reassuring the small countries that they’ll get theirs, while the large countries recognize implicitly that they’re not any better off with guarantees, isn’t exactly reassuring.
Nevertheless, the reaction is telling. Right now, George Bailey is asking that nice old lady how much she can get along with, and praying that she doesn’t just name her account balance.
Bad News on the Colorado Jobs Front
Posted by Joshua Sharf in Business, Colorado Politics, Economics, PPC on August 19th, 2011
Colorado continues to shed workers and jobs, according to the latest release from the Bureau of Labor Statistics. On a seasonally-adjusted basis, Colorado’s unemployment rate held steady at 8.5%, but only because fewer people were looking for work.
| Labor Force | Employed | Unemployed | ||||||
|---|---|---|---|---|---|---|---|---|
| July 2010 | June 2011 | July 2011 | July 2010 | June 2011 | July 2011 | July 2010 | June 2011 | July 2011 |
| 2,682.8 | 2,682.0 | 2,674.4 | 2,446.2 | 2,453.2 | 2,447.9 | 236.6 | 228.8 | 226.5 |
| -8.4 | -7.6 | Change | 1.7 | -5.3 | Change | -10.1 | -2.3 | Change |
Since July of last year, we have 8400 fewer people in the labor force, and the number employed has barely budged. The number of unemployed has fallen roughly 10,000, but almost all of that is a result of people leaving the state or giving up. In the last month alone, the labor force shrank by 7600, and we lost 5300 jobs.
In the meantime, the average duration of unemployment has shot past 40 weeks:

This isn’t just lost income. It’s skills and connects that have gone stale, knowledge of their own market that has become outdated, and declining confidence that things will get better anytime soon.
The long-term unemployment is mostly among men, and mostly among less-educated, and those two classes increasingly overlap. Keep this sort of thing going long enough – and it doesn’t take too terribly long to become self-reinforcing – and we’re liable to have a lot of cities looking like last week’s London sometime before 2020.
Farmaggedon?
Posted by Joshua Sharf in Business, China, Economics, PPC on August 18th, 2011
Who says real estate’s been a bad investment over the last few years? Not if you’re buying midwestern farmland.
The Chicago Fed puts out a quarterly survey of farmland prices, and this past quarter, prices were up 17%, year-over-year. Here’s what the chart looks like since 1964:
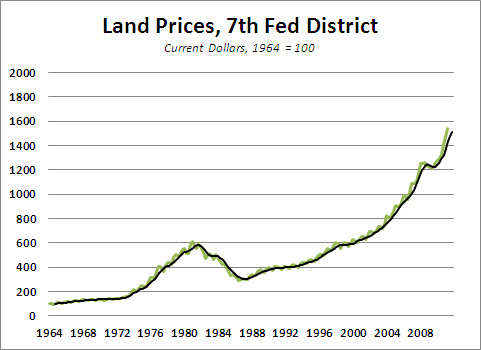
A couple of words on how this chart was derived. The Fed’s survey only lists quarter-to-quarter and year-over-year changes, not the raw number, and the data for download is only the year-over-year change, rounded to the nearest percentage point. So I had to work backward, getting the last four quarter-to-quarter changes, and then backing out the annual changes for each year. As a result, I can’t tell whether there’s an actual seasonality to land prices (which wouldn’t surprise me) or that annual dip is a result of some small variation in a recent year, that gets carried backwards (which also wouldn’t surprise me). Thus the prominence of the 1-year moving average.
You can see the bubble starting around 1976, popping in 1981, and taking until about 1986 to return to the trend line. Those of you hoping to recoup your recent residential real estate losses – sorry.
You also see the line take a nice bend upwards about 2002 or so, hits a little hiccup in 2008, and then resumes the trend. There are a few reasons for this: consolidations of small family farms into large operations plays a role, as do the expanding suburbs. Unike houses, they can’t build more farmland. Recently, you can add to that better-fed Chinese, who are buying lots of American corn to feed their soon-to-be mooshu pork.
All of which goes to explain why it’s a terrible idea to be sending about 1/3 of our corn crop to ethanol. Farmers may like them, the ethanol industry couldn’t survive without them, but the demand subsidies – the requirements that a certain percentage of our fuel come from ethanol – are clearly helping to drive up the price of corn, and the price of the means of production of that corn, and its sometime substitute, soybeans.
(As mentioned before, it also drives up the price of natural gas, needed for the fertilizer that soil-depleting corn needs, in order to grow year after year on the same plot of soil.)
People borrow to buy farmland, too. The interest rates on farmland loans have been trending downward for a long time, and have been mostly under 6% for the last 10 years.
Suffice it to say, this is not going to end well.
A Transfer on the Road to Serfdom
Posted by Joshua Sharf in Business, Economics, PPC on August 3rd, 2011
As an emblem of what Walter Russell Mead calls, “the Blue Social Model,” there’s almost no place Bluer than New York. So it seems fitting to pay homage to the home of the modern patronage state in a post devoted to transfer payments.
We all know that transfer payments – Welfare, Social Security, Medicare, Medicaid, Unemployment Benefits – have been growing at an unsustainable pace, and are the source of our long-term structural problems. We’re also aware that once a program acquires a sufficient constituency, it’s almost impossible to reduce, let alone do away with. Thus the concern when the top few percent of earners pay 40% of all income tax, and when half the country pays no income tax at all.
This dramatic Calculated Risk post about recession measures has gotten a number of people’s attention, but what struck me was the qualifier on the Personal Income chart: less transfer receipts. Transfer receipts don’t count towards GDP, with good reason, but they certainly subtract from the country’s capital available for investment or spending. They’re also the key, most public, most obvious way of obtaining a constituency for higher taxes and continued spending. We’re now reaching the point where almost $1 out of every $5 of personal income comes from transfer payments (the scale on the left is in $ billions):
![]()
You can see the large boost given as Medicare and Medicaid took hold in the late 60s and early half of the 70s. Through the 80s and 90s, the numbers continued to slope upwards, but a robust economy kept them largely between 12% and 14%, or between 1/7 and 1/8 of personal income. Then, with the financial crisis and the preceding recession, they went through the roof. For the first time, a boost in transfer payments was also accompanied by a year-over-year drop in aggregate personal income. It’s that spending percentage that Obama and the Democrats want to lock in as the floor for the economy.
Colorado has it a little better, or maybe is just lagging behind the rest of the country (the scale on the left is in $ millions) :
![]()
In the 90s, as Colorado recovered from the commodities bust and attractive tech talent from around the country, the percentage of income derived from transfer payments fell just barely above 8%. The recession of the early ’00s hit, and the slower growth of that decade, while real, was only enough to just balance the increase in transfers. Some of this was a result of Colorado’s generosity to its own citizens, as the legislature loosened rules for Medicaid. The state, of course, followed the rest of the country in a near-vertical climb in ’09.
The number is starting to decline gently as unemployment benefits run out, and incomes begin to slowly recover.
The chart, although the time scale is different from the one for the country as a whole, points out the main lesson of all this: growth is the only way out of this problem. It can’t be healthy for $13 of every $100 of personal income to come from an unearned government check. It’s even worse for the country as a whole. And the deepening dependency of more and more people is only going to make the political will necessary to break this cycle harder to find.
Green Still Costs Green
Posted by Joshua Sharf in Business, Economics, Energy, PPC, President 2012 on August 2nd, 2011
Regular readers know, my favorite left-of-center blogger is Walter Russell Mead, over at The American Interest. The reason Mead is so interesting is that, unlike the Paul Krugmans and Ezra Kleins of the world, he’s willing to challenge liberal shibboleths, recognizing that for liberalism to be more relevant, it needs to be more intellectually robust. At times he writes almost like a conservative, although he’s not. This morning is one of those posts:
Wal-Mart has hitched its wagon to the local food train, but not to save the planet. It’s the money. As Darrin Robbins, Wal-Mart’s senior manager for produce told the Wall Street Journal:
“We can get chili peppers from Florida all day long, but at the end of the day that is not necessarily the best model for us” … “I’m going to pay a higher price in Ohio for peppers, but if I don’t have to ship them halfway across the country to a store, it’s a better deal.”
It turns out that in the age of high gasoline and transportation costs, local produce is ultimately cheaper.
I’ve written before that Walmart is doing more for the planet than Greenpeace; this is just more proof. A ruthless focus on price and efficiency is the best way to reduce humanity’s environmental footprint.
I think his conclusion is right: companies dislike waste more than most Greenies do – it hurts the bottom line. Usually Greenies are wasting someone else’s time or money. This doesn’t mean that some companies wouldn’t willingly forgo all sorts of reasonable environmental protections if they could, although it’s worth noting that the worst environmental disasters of the last century were centrally planned by the Soviet, and this century’s are shaping up to be centrally planned by the Chinese.
Nevertheless, I think he misses a more subtle point. Those higher gasoline and transportation costs are real, and they are the result of governmental policies, usually pursued by Democrats specifically in order to drive up fuel prices. They’ll admit this during primaries. Wal-Mart is simply responding to incentives.
The problem, of course, is that “buy local,” unless is some specialty item, almost always means a lower standard of living. It makes you more dependent on a smaller base of supply, and decreases out-of-season availability. If the local crop fails, you still have to import the food from farther away, at the higher cost. I don’t have data to back this up, but it would also make sense that the availability of long-haul refrigerated units for produce would decline along with demand, which adds even more to the marginal cost of replacing a local supply gone missing.
The country always undergoes a series of local crop failures which go unnoticed by consumers. Now they’ll be more likely to notice those failures, and more likely to hear someone other numb-nut attributing it to your air conditioning, as well. So not only do we bear the cost of food, we also have to put up with the sermonizing.
Mead’s incredibly insightful about larger social and economic trends, so it’s a shame to see him missing a trick on this one.
Obama’s Evergreen Goes Brown
Posted by Joshua Sharf in 2012 Presidential Race, Business, Economics, Finance, National Politics, PPC on July 28th, 2011
Barack Obama and Harry Reid may not be able to produce a spending plan, but at least they have their old campaign talking points from 2008 to fall back on.
With the Senate having failed to produce a budget in over 2 years, the President’s budget having succeeded in uniting Washington to a degree not seen since it was under threat of attack 150 years ago, and neither willing to commit a spending plan to paper, they can be relied on to Blame Bush!
The White House has put out a graphic purporting to show that – surprise! – 8 years under President Bush added more to the national debt than 2 years under President Obama. (They play with the numbers, by assuming that the cut in marginal tax rates didn’t stimulate growth, for instance.) That President Bush wasn’t exactly a fiscal conservative like FDR isn’t a secret to anyone. In its day, what was seen as recklessness spawned Porkbusters, the Tea Party in embryo.
But let me remind you of this chart, originally in the Washington Post:

It’s been updated by the Heritage Foundation:
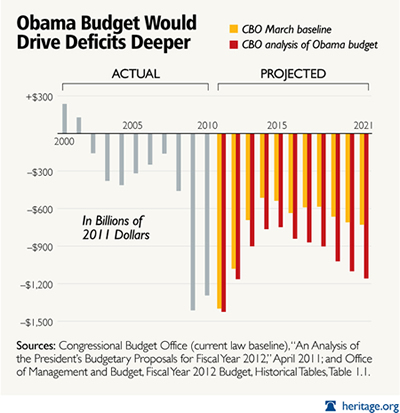
Much as Babe Ruth redefined baseball by showing what could be done when you try to hit home runs, so has Obama redefined deficit spending by showing what happens when you really put your heart and soul into it. You’ll notice, by the way, that the latter graph compares the CBO to itself, rather than to the White House budget, because, haha, there isn’t a White House budget.
Note also how the color bars in each graph look the same, only they’re shifted to the right by two years in the update. It’s evident that 2010 and 2011 haven’t worked out as planned. It’s no wonder that Tea Partiers don’t really believe in out-year cuts; the deficit reduction hasn’t occurred because Obama’s policies and those of Congressional Democrats have stifled economic growth, and because they’ve been happy to govern illegally, without a budget for two years, leaving federal spending essentially on auto-pilot.
The other argument you hear is that Paul Ryan’s budget made use of the same accounting trick that Harry Reid’s budget-avoidance bill does: counting savings from the Iraq and Afghanistan wars we won’t be fighting. But Ryan’s plan was an actual budget. There were always holes, but the difference between “will spend” and “would have spent” means a lot less when you’re drafting an actual plan, than the difference between “will spend” and “will take in.” Ryan applied that $1,000,000,000,000 to a headline.
Reid proposes to let the President spend it between now and Election Day 2012.
The Democrats won’t produce a budget because they can’t, only they don’t want you to know that until after the election. So much for them.
The Tea Party folks have a different complaint, namely that Boehner’s Plan doesn’t go far enough. I’d like to see more cuts, too. But the idea, as I recall, was to use the debt ceiling deadline as a means for forcing a debate, forcing changes to the spending that is current and planned. It was never realistic to run the entire federal government out of the House of Representatives.
To that extent, the plan has been wildly successful. It has exposed the Democrats as dangerously delusional about the state of our finances, whose only current idea is to soak you to ratify a massive increase in the scope of our economy directly controlled by the government. The Boehner Plan re-adjusts the baseline, keeps the debate on the front burner pretty much through the election, and does it without raising taxes. These are major victories, and they would not have been possible without the Tea Party. Period.
That said, this particular fight is one of many. Pushing too hard right now, bringing on a technical default, or, more likely, putting incredible discretionary power in the hands of a teenage president, won’t be Sherman marching through Georgia, it’ll be Napoleon marching to Moscow.
There is considerable frustration abroad that we can’t simply win this thing already. But politics isn’t about that. Regardless, we’ll have to keep watching, pushing, and prodding. There aren’t any final victories in politics, either over the other party or within your own. The best use of this battle is to pocket the gains, and use the process to help prepare the battlefield for the next fight.
-
You are currently browsing the archives for the Economics category.


