Archive for category Colorado Politics
Purim as an Argument Against Gun Control
Posted by Joshua Sharf in Colorado Politics, Jewish, PPC on February 22nd, 2013
I’m always reluctant to re-read religious texts with a political slant. The Left has, for the most part, sought to replace religion with politics with the sort of baleful results we saw in 20th Century Europe and Russia. Even today, the American Jewish left uses such Jewish concepts as “Tikkun Olam” to justify pretty much the entire leftist political agenda, and JCPA General Assembly resolutions to that effect almost always find some Torah text to torture into testifying on their behalf. So to the extent that I’m edging across a self-imposed line here, the people it’s most likely to unnerve are the very liberals who’ve gotten used to thinking of the Torah as their personal political property.
But to the extent that Judaism has a political holiday, Purim is it. The internal power and factional politics of the Persian Empire, the Jews’ place in a multi-ethnic society, Megillat Esther is steeped in politics, and thus, human nature.
So for those who think that voluntarily disarming Jews is a good idea, consider the manner in which Ahasuerus’s decree of doom is reversed. Not by repeal, which the text tells us is beyond the King’s legal authority. Instead, it’s negated this way (8:11):
…that the king had given to the Jews who are in every city, [the right] to assemble and to protect themselves, to destroy, to slay, and to cause to perish the entire host of every people and province that oppress them…
We don’t need to carry the argument to the reducto ad absurdum of the Holocaust or the Holocaust-that-wasn’t in the Megillah to make this point. Even in the US, from time to time, anti-Semitic riots do happen.
The President of the United States has invited the instigator of two such riots to the White House to advise him on economics, and granted him a television interview. Both the Crown Heights riots and the Freddy’s Fashion Mart riots were anti-Semitic and Sharpton’s handiwork.
The ADL was founded as the result of one such riot that turned into the lynching of a Jewish man – in spite of the efforts of the authorities to prevent it.
And Seraphic Secrets’s hair-raising description of being defenseless during the Rodney King riots in LA, when the police abandoned the field, should drive home the point that riots need not be anti-Semitic in nature to be deadly.
In a country where we have that right by law – the same as all other citizens, and without any special royal dispensation necessary – why would we voluntarily cheapen Jewish blood again by disarming ourselves?
So tomorrow night and Sunday, when we’re celebrating our victory over our enemies, let’s also spare a thought for the fact that, unless we choose to give it up, here in the US, we have as a matter of course the very same rights that gave us that victory.
Happy Purim!
The Higher-Ed Bubble, In One Chart (and one article)
Posted by Joshua Sharf in Budget, Colorado Politics, Education, PPC on February 16th, 2013
Rep. Mike Coffman took a lot of heat for suggesting that perhaps it was time to re-evaluate these priorities, with his words being distorted into an attack on the liberal arts in particular, and higher education in general. Turns out he was onto something.
- Sociology
- Fine Arts
- Education
- Religious Studies/Theology
- Hospitality/Tourism
- Nutrition
- Psychology
- Communications
Just for grins, I looked up how many of CU’s undergraduate degress over the last quarter-century (well, since 1989), have been awarded in these majors:

For fun, I added in almost anything with the word “Studies” in it, and that’s what the percentage line (right-hand axis) shows.
Peaking at just over one-third of all bachelor’s in 2004, over 30% of all undergraduate majors are still in these low-return majors. The dropoff occurred between 2004 and 2008, but has since – astonishingly – stabilized since the popping of the housing bubble, when job prospects for graduates have almost never been worse. Students are taking on crushing burdens of debt to graduate with these degrees.
You and I will be subjected to sob stories about how Colorado is under-funding its higher education. Instead, perhaps we ought to be taking a closer look at what we’re funding.
Is Legislative Stinginess to Blame for PERA’s Problems?
Posted by Joshua Sharf in Finance, PERA, PPC on January 28th, 2013
One of the favorite tropes of PERA apologists runs like this: PERA was fully-funded in 2001 or so, at which point the state legislature began failing to make 100% of its Annual Required Contribution (ARC). It was then that PERA’s funded level began to drop off. Therefore, if the state legislature had fully-funded the ARCs, today, PERA would not face a massive unfunded liability.
It’s a rhetorical masterstroke, redirecting blame for the current situation on a stingy state legislature that put PERA last in its priorities. And while grounded in a grain of truth, it severely understates and misattributes the nature of PERA’s financial crisis-in-the-making.
The grain of truth is this: the state legislature, beginning in 2003, began to under-pay its Annual Required Contribution. Of course, this affects not only the immediate year, but all future years going forward. Not only is the money from the shortfall not there, but the accumulated return on those dollars aren’t there, either. For this post, I’m just going to focus on the two largest divisions, the School Division and the State Division. They were combined in 1997, and separated again in 2006, so I’ll consider them as a unit.
Here are the yearly shortfalls, along with their future values to the end of 2011 (the latest year for which we have data). The first year for each underpayment is dollar-cost-averaged, so we give half the year’s return, and full yearly returns thereafter:
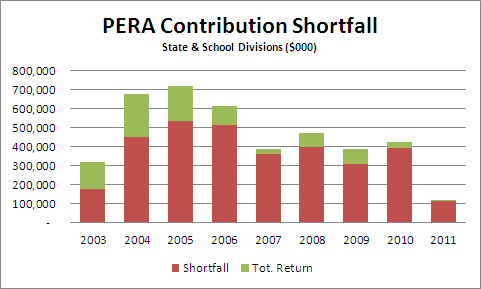
For 2003, the legislature underpaid by about $177 million, costing about $142 million in future returns, for a total effect in 2011 of $319 million. If you add up the total effect, year-by-year, you get the following result:
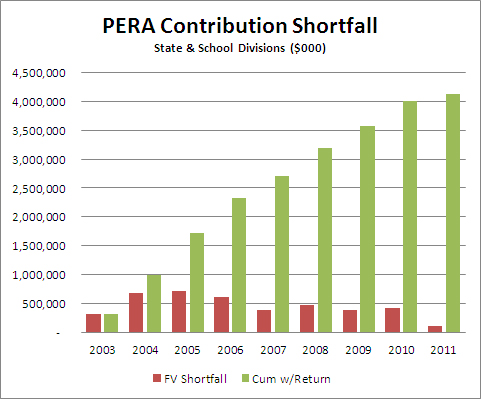
So by the end of 2011, the cumulative effect of 9 years’ worth of funding shortfalls is a little over $4 billion. The argument by PERA hinges on the fact that it’s at 2003 that PERA began to be underfunded:
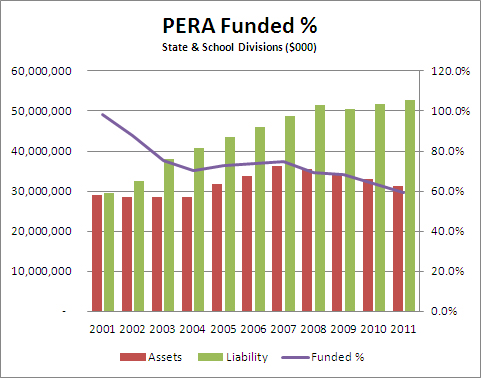
As you can see, though, PERA was already suffering from poor 2001 and 2002 returns, even though there was no shortfall from the state those years. What did increase substantially was the size of the liability; the size of the assets actually held steady. From 2004 to 2007, solid returns managed to keep the dollar amount of the gap from growing. But then 2008 hit, and the size of the obligations continued to increase even as the fund got clobbered in the market. The liability dropped as a result of certain stop-gap changes that were made in 2009, but has since resumed its upward march, even as the actuarial value of the divisions’ assets has continued to fall.
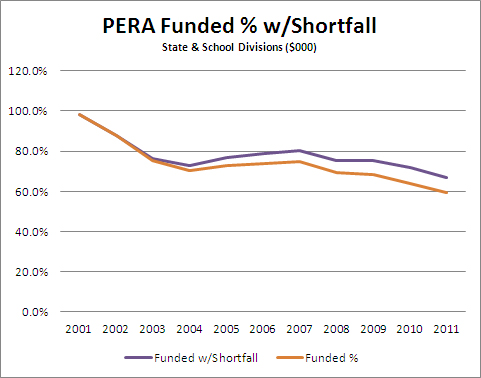
Would it have made a difference if the state had made good on its entire ARC for 2003-2011. The answer is yes, but not very much. Adding in the cumulative shortfall each year, here’s the effect on the assets and the funded ratio for the State and School Divisions:
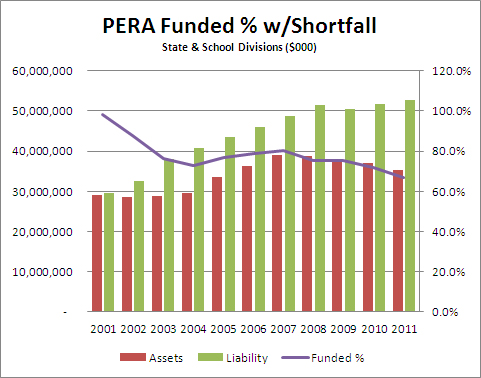
Despite some increased, they’re still seriously underfunded. Since it’s difficult to see the difference between the two charts, I’ve made the comparisons here. First, the difference in assets:
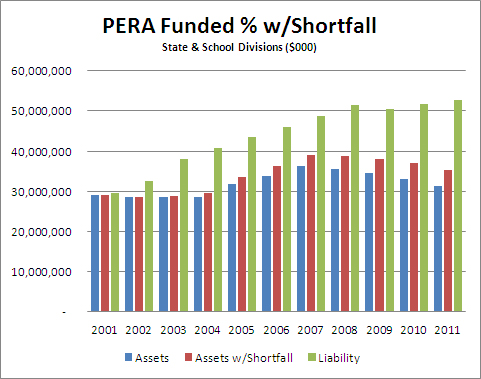
An increase of total assets from $31 billion to $35 billion is not nothing, as they say down at the station, but it’s also not nearly enough to start to close the gap with liabilities. So little that the difference in funding ratio barely moves the needle:
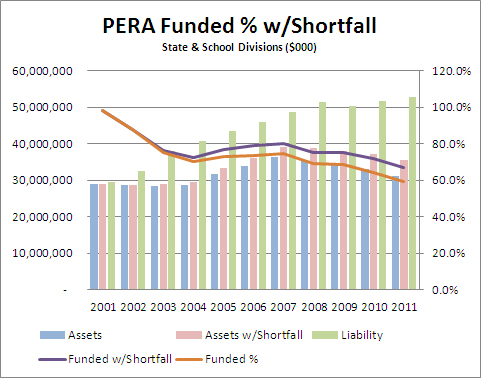
For those of you who want it all on one chart, possibly for optical exams, here it is:
In reality, it’s worse than this. Prior to 2006, PERA didn’t report a sensitivity analysis on its assumed rate of return, so we have only the values for 8%. If we assume a more realistic 6.5% return going forward the unfunded liability grows from $25 billion to about $40 billion, and the extra $4 billion makes even less of a dent.
PERA isn’t suffering from a legislature that isn’t keeping its promises, it’s suffering from having made promises it can’t keep. And it’s the very PERA members who are going to get hurt the most, the ones who’ve been sold a bill of goods about what’s waiting for them when they retire.
Lowering the Hill
Posted by Joshua Sharf in Budget, Colorado Politics, PERA, PPC on January 23rd, 2013
Ultimately, large changes will be needed to keep PERA solvent. But little changes can have an effect, too. Today, the state House Finance Committee will be hearing HB13-1040 from Republican Rep. Kevin Priola:
Current law averages the 3 highest annual salaries of a member of the public employees’ retirement association (PERA) when calculating that member’s retirement benefit amount. The bill increases the number of highest annual salaries used from 3 to 7 for anyone who was not a member, inactive member, or retiree of PERA as of December 31, 2013.
In 2010, SB1 changed some rules to make it more difficult for employees to suddenly spike their salaries and other compensation at the ends of their careers, in order to game the system and maximize their PERA benefits. For instance, for benefit calculation purposes, raises and other increases in compensation – like saved vacation being cashed in – were limited to 8% in any given year. Employees could receive larger raises, but benefits could only be calculated on the first 8% of the increase.
This bill would make it even harder to game the system by averaging the highest seven years’ compensation instead of the highest three. It’s a reasonable measure, and it would only apply to employees who join PERA after the end of this year. The Democrats enjoy a large majority on the Finance Committee, so they may well kill the bill. But the fact that it got assigned to the Finance Committee at all, rather than relegated like SB13-055 to the State, Veterans, and Military Affairs Committee, makes the outcome less certain.
Democrat Sen. John Morse Follows Familiar Pattern On PERA Reform
Posted by Joshua Sharf in Budget, Colorado Politics, PERA, PPC on January 23rd, 2013
The state Democrats, led by State Senate President John Morse (D-Colorado Springs), are continuing their deeply unserious approach to Colorado’s massive unfunded PERA liability this session. Incoming Speaker of the House Mark Ferrandino (D-Denver) had already indicated as much, first by characterizing those who would seek to deal with the problem as wanting to use the economic situation as an excuse to take away public employee’s pensions, and then by appointing Lois Court (D-Denver) as Chairman of the House Finance Committee.
The latest sign comes with respect to a bill proposed by Republicans Sen. Kent Lambert of Colorado Springs and Rep. Lori Saine, a freshman Republican from Dacono. The bill, SB13-055, would require PERA to use the state’s long-term borrowing interest rate as the discount rate for its liability, and would require that the CAFR be released by May 31 of each year. It would also require that contribution and/or benefit levels for any individual fund be adjusted when the amortization period for that fund climbs beyond 30 years.
All of these are eminently reasonable proposals. For reasons discussed before, the discount rate should be the required rate of return of PERA’s investors, the members. There is also no real reason why PERA can’t produce a CAFR within five months of the end of the calendar year; those dates have been slipping in recent years, but the fact is, the bulk of the CAFR is boilerplate or easily-written text, and the same financial statements and charts each year. And since the stated goal of PERA is to be within a 30-year amortization window, requiring them to be so would simply put teeth into an existing target.
Yet Sen. Morse has chosen to assign the bill not to the Senate Finance Committee, which has jurisdiction over PERA oversight, but to the State, Veterans, and Military Affairs Committee. That committee, often referred to as the “kill committee,” is traditionally staffed with the most partisan members of both parties, and used to kill inconvenient bills. Often that’s because “no” votes on the bills might be embarrassing to the majority, perhaps sufficiently embarrassing that some members wouldn’t be able to resist the temptation to vote for them.
That Senate President Morse has chosen to put this bill in front of the kill committee is practically an admission of its common sense, and his lack of it, but it does make clear the two halves of the Democrats’ full-court defense of their public employee clients’ pension plans.
First, they’ll protect them from any votes they might lose, and also protect the House and Senate Finance Committee members from having to cast “No” votes they’ll later have to explain.
Second, both Ferrandino and Morse have claimed that 2010’s SB1 “solved” the PERA problem for good, though tremendous liabilities remain, even given the plan’s own overly-optimistic assumptions and accounting practices. That will be their explanation for dodging these votes, but even if true, it’s a non sequitur. If PERA is truly fixed, surely members of the committee charged with its oversight would not only be the best-informed of that fact, but also best able to explain it to constituents. Putting the bill in front of a committee whose actual charter has nothing whatsoever to do with PERA, and whose reputation is one of chief enforcer, can’t inspire much confidence that the Democrats will be dealing with the state’s financial problems in good faith in the next two years.
The Hill Gets A Very Little Less Steep – For Now
Posted by Joshua Sharf in PERA, PPC on January 22nd, 2013
One of the main points of contention about PERA has been the expected rate of return. Up to 2001, PERA used an expected rate of return of 8.75%, but lowered that to 8.5% from 2002-08, and again to 8% in 2009, where it now stands.
So how has PERA done since 2001, when it stood at a 100% funding level? The chart below shows the annual return over those 11 years for which they’ve reported, plus an estimated return based on a similar portfolio from CalPERS, the California pension plan. CalPERS has a .99 correlation with PERA, which is about as close to metaphysical certainty as anything human gets. In 2012, CalPERS reported a 13.26% return, which would project a 13.9% return from PERA, so just for grins, I’ve plugged that into the 2012 spot.
The red line is the running CAGR from 2001, or Cumulative Average Growth Rate for 2001 through the current year.

As you can see, over time the red line becomes less volatile, as more years are factored into the average.
The green and purple lines are where it gets interesting. Those lines are the return that PERA would have to see over the remainder of the 30-year window from 2001-2030, in order to meet the 8.75% and 8% targets. So, for instance, after 2007, in order to have a CAGR of 8.75% from 2001-2030, PERA would have to have returns of 9.3% from 2008-2030.
Note that using the 8% return from 2001 basically gives hindsight credit to PERA, since in 2001 they were projecting 8.75%, not 8%. Let’s blow up that part:

As you can see, PERA started out with poor 2001 and 2002 returns, which put it in an immediate hole. Even good returns from 2003-2007 only got the required returns down to 9.3% and 8.3%, respectively. Then 2008 happened. By now, we’re 12 years into that 30-year window, and even a good year like 2012 will only push the required return down a little bit, about 0.3%. For instance, it would take 7 years of 15% returns to get the required return for the 8.75% line down to below 8.75%, in effect, to catch up to the 8.75% projection, and it would take 5 more years to catch up to the 8% projection. It’s highly unlikely that even 5 years will pass without a normal, cyclical recession, and attendant lower returns.
The average return is 6.28%, the CAGR is lower, just over 5%. In fact, any set of returns with an average of 8%, but which are not actually 8% each year, will compound to less than 8%, making it that much harder to make up ground. Bear that in mind when someone talks about how easy it is to make up for a couple of bad years.
All of this argues for using a Monte Carlo simulation to determine solvency, rather than a simple rate of return. Such a model is a little more expensive to run, but will give a far more accurate picture of the health, or lack thereof, of any defined benefit plan.
PERA – It’s All For The Kids
Posted by Joshua Sharf in Education, PERA, PPC on January 20th, 2013
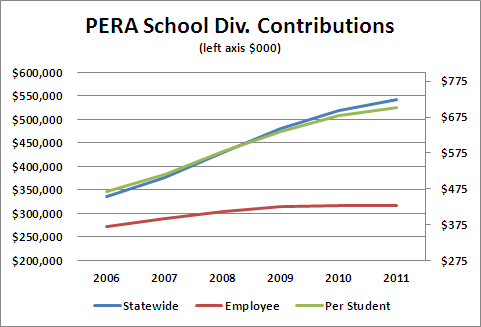
Not all school spending is for the kids. A lot of it is for the teachers, at the expense of the kids. Over the last five years, even as school districts and teachers unions complain that per-student spending has been “slashed,” “cut to the bone,” or “eviscerated,” per-student spending on the PERA School Division has been growing well beyond inflation. Here are the per-student contributions by the major local school districts (minus Denver, which has its own PERA division), and statewide:

Over the least 5 years, this has translated to growth rates well in excess of inflation:

And who’s been picking up the tab? The Employer contribution has been growing far in excess of the Employee contribution in absolute terms. The employer contribution has been growing at 10% per year from 2006-2011, while the Employee contribution has grown at a 3% rate over the same period. The overall per-student increase has been just under 8.5%.
Not only is PERA taking money from the classroom, it’s taking taxpayer dollars from the classroom at a wildly disproportionate rate. Is this what the teachers unions mean by “shared sacrifice?”
PERA’s Resolute Optimism, Part 2
Posted by Joshua Sharf in Colorado Politics, PERA, PPC on December 9th, 2012
In the previous post, I mentioned that PERA, in retaining its 8% expected rate of return, was persisting in an unwarranted optimism, one that is likely to end up costing the citizens of Colorado billions of dollars down the line. Part of the evidence was that other municipal pension plans around the nation have recently lowered their expected rates of return. That said, as of 2009, the overwhelming number of plans in the Center for Retirement Research’s Public Plans database were living in what can only be described as Fantasyland, as the following histogram shows:

I’m sure the right part of the graph, which resembles a strong signal from those plans to their taxpayers footing the bills, is only accidental.
In fact, between 2001 and 2009, plans were extremely reluctant to revise their expected rates of return, despite the fact that they rarely met them for more than a year at a time, and continued to fall farther behind in their funding. If you look at actual returns for those years, they don’t come anywhere close to what was projected:

The result is that plan assets haven’t kept up at all with plan liabilities, even in these years when the market has performed reasonably well (Source: Public Fund Survey):

Understanding that many factors go into whether a plan’s funded level increases or decreases, the fact is that looking forward from 2001 to 2009, over the succeeding 21 years, the median plan would have to return about 10.5% over the following 21 years, to make up for having fallen behind in the first decade:

The problem, of course, is that plans have spending requirement every year; they can’t simply choose to sit on their assets and wait for their investments to catch up. It means that low returns in early years require even higher returns in the later years for the plans to return to 100% funded levels, without increasing cash infusions or a reduction in benefits.
One guess as to which will be the plans’, the governments’, and the SEIU’s first choice.
PERA’s Resolute Optimism
Posted by Joshua Sharf in Colorado Politics, PERA, PPC on December 7th, 2012
PERA’s Board recently voted to retain its wildly optimistic expected rate of return of 8% over the next 30 years. The decision has the effect of reducing the unfunded liability twice – once through higher returns, and again because they mistakenly use the rate of return as the discount rate. Remarkably, PERA’s board made that decision even as pension plans all over the country are reducing their expected rates of return.
The latest is the Orange County Employees Retirement System, which called a special meeting for Thursday evening to lower its expected return from 7.75% to 7.25%. It follows CalPERS, CalSTRS, and about 40 others of the 126 public plans in the National Association of State Retirement Administrators’ Public Fund Survey.
The most direct parallel is the change made only Tuesday by the Pennsylvania Municipal Retirement System, which lowered its expected rate of return from 6% to 5.5%, starting January 1. PMRS’s returns closely track those of PERA, returning an annualized 0.5% less per year over the last 10 years than PERA:

That comes to an annualized rate of 5.3% over the last decade for PMRS, or just below their new rate of 5.5%. PERA’s barely done better, and 5.8%, but insists on retain an industry standard, and wildly unrealistic, 8% expected rate of return.
Note that PERA’s average rate of return is 6.9%, while its cumulative average return is 5.8%. Of course, you can’t spend average returns, you can only spend cumulative returns. Yet another reason for PERA to be more, rather than less, conservative.
On the other hand, it must be encouraging to see PERA’s resolute optimism at a time when so many other plans are losing heart.
PERA, Personally
Posted by Joshua Sharf in Colorado Politics, PERA, PPC on December 5th, 2012
One of the hardest things about discussing PERA’s liability is the sheer magnitude of the numbers involved. Twenty-five billion used to sound like a lot, until we started throwing around trillions. Forty billion, likely closer to the real number, sounds like it might be more, but it’s almost impossible to gauge how much more.
The chart below tries to show how PERA’s unfunded liability has grown in terms of our ability to pay it off. In 2000, PERA was nominally overfunded, meaning that all of its long-term liabilities were accounted for, and then some. In reality, this almost certainly wasn’t the case, but for the purposes of this post, we’ll just use PERA’s own current-dollar estimates of its unfunded liability.
Using BEA numbers for Colorado’s GDP, its total Personal Incomes, and its population, it’s a little easier to see the threatening direction this debt is taking. On a per-person basis, the unfunded liability now sits at just over $4000. That means that, to pay off the unfunded liability, it’s $4000 out of the earnings of the average Coloradoan. This includes those who are too old and too young to work, so for the average worker, the number is much higher. Four thousand dollars may not sound like a lot, but of course, it’s going to get worse – likely, much worse – before it starts to get better.
As a percentage of the state GDP and Personal Income, things are even more discouraging. PERA’s liability amounts to 8.15% of Colorado’s GDP, and nearly 10% of the total Personal Income. But this isn’t the only debt that the state, local, and district governments owe on your behalf, and it’s likely not the only debt you owe, either.
From 2004 to 2007, the ratios appeared to improve, but if you look closely, you’ll see that during a period of strong growth, the per-person dollar liability was flat, and the per-GDP and per-PI percentages barely moved. This strongly suggests that this is a liability that it’s going to be very hard to grow out of.
PERA will be quick to point out that you’re not going to be expected to cough up all of this money at once, and that they have a long-term, 30-year glide path to solvency. Any time any government program says it has a 30-year plan for solvency, you should stop listening and start moving your money someplace else. As we’ve noted before, PERA is significantly understating the size of the unfunded liability, both by overstating the rate of return and by misusing the discount rate. Moreover, mentally amortizing the liability over 30 years makes it that much easier to ignore until someone misses a payment, and the whole structure comes crashing down. I’m sure that San Bernadino and Stockton were using similarly comforting thoughts before they filed for Chapter 13.

-
You are currently browsing the archives for the Colorado Politics category.


