One of the favorite tropes of PERA apologists runs like this: PERA was fully-funded in 2001 or so, at which point the state legislature began failing to make 100% of its Annual Required Contribution (ARC). It was then that PERA’s funded level began to drop off. Therefore, if the state legislature had fully-funded the ARCs, today, PERA would not face a massive unfunded liability.
It’s a rhetorical masterstroke, redirecting blame for the current situation on a stingy state legislature that put PERA last in its priorities. And while grounded in a grain of truth, it severely understates and misattributes the nature of PERA’s financial crisis-in-the-making.
The grain of truth is this: the state legislature, beginning in 2003, began to under-pay its Annual Required Contribution. Of course, this affects not only the immediate year, but all future years going forward. Not only is the money from the shortfall not there, but the accumulated return on those dollars aren’t there, either. For this post, I’m just going to focus on the two largest divisions, the School Division and the State Division. They were combined in 1997, and separated again in 2006, so I’ll consider them as a unit.
Here are the yearly shortfalls, along with their future values to the end of 2011 (the latest year for which we have data). The first year for each underpayment is dollar-cost-averaged, so we give half the year’s return, and full yearly returns thereafter:
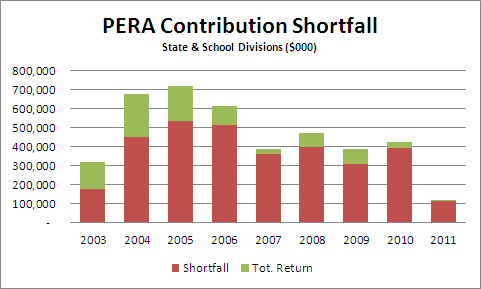
For 2003, the legislature underpaid by about $177 million, costing about $142 million in future returns, for a total effect in 2011 of $319 million. If you add up the total effect, year-by-year, you get the following result:
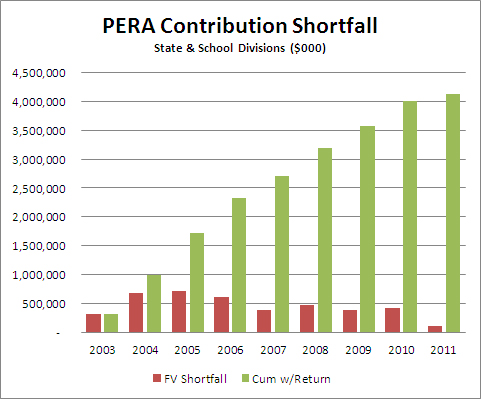
So by the end of 2011, the cumulative effect of 9 years’ worth of funding shortfalls is a little over $4 billion. The argument by PERA hinges on the fact that it’s at 2003 that PERA began to be underfunded:
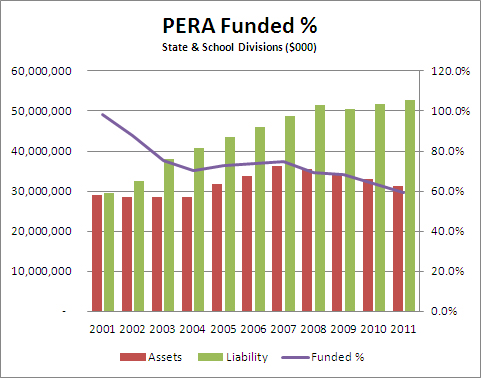
As you can see, though, PERA was already suffering from poor 2001 and 2002 returns, even though there was no shortfall from the state those years. What did increase substantially was the size of the liability; the size of the assets actually held steady. From 2004 to 2007, solid returns managed to keep the dollar amount of the gap from growing. But then 2008 hit, and the size of the obligations continued to increase even as the fund got clobbered in the market. The liability dropped as a result of certain stop-gap changes that were made in 2009, but has since resumed its upward march, even as the actuarial value of the divisions’ assets has continued to fall.
Would it have made a difference if the state had made good on its entire ARC for 2003-2011. The answer is yes, but not very much. Adding in the cumulative shortfall each year, here’s the effect on the assets and the funded ratio for the State and School Divisions:
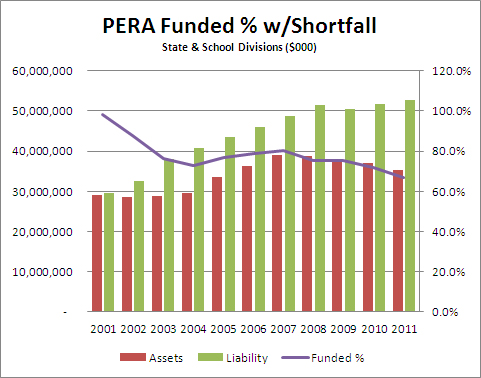
Despite some increased, they’re still seriously underfunded. Since it’s difficult to see the difference between the two charts, I’ve made the comparisons here. First, the difference in assets:
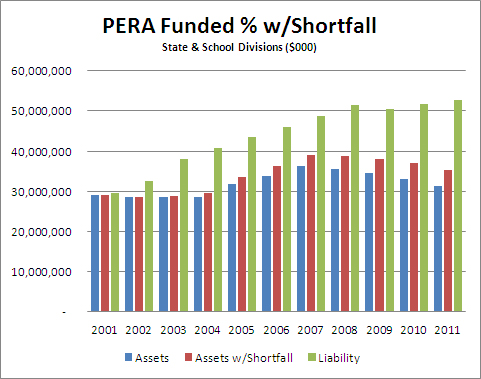
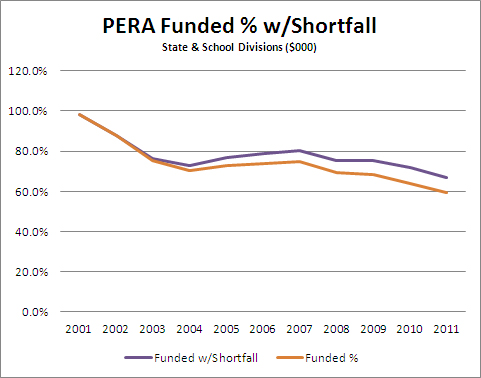
An increase of total assets from $31 billion to $35 billion is not nothing, as they say down at the station, but it’s also not nearly enough to start to close the gap with liabilities. So little that the difference in funding ratio barely moves the needle:
For those of you who want it all on one chart, possibly for optical exams, here it is:
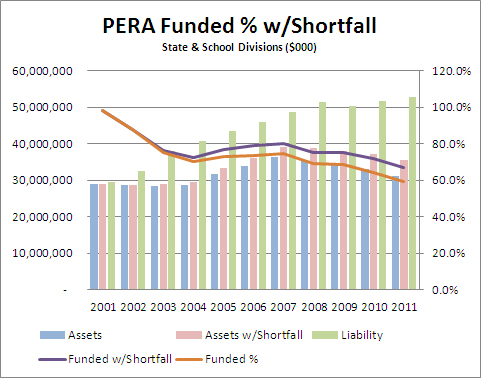
In reality, it’s worse than this. Prior to 2006, PERA didn’t report a sensitivity analysis on its assumed rate of return, so we have only the values for 8%. If we assume a more realistic 6.5% return going forward the unfunded liability grows from $25 billion to about $40 billion, and the extra $4 billion makes even less of a dent.
PERA isn’t suffering from a legislature that isn’t keeping its promises, it’s suffering from having made promises it can’t keep. And it’s the very PERA members who are going to get hurt the most, the ones who’ve been sold a bill of goods about what’s waiting for them when they retire.


