Posts Tagged Public Pensions
PERA’s Resolute Optimism, Part 2
Posted by Joshua Sharf in Colorado Politics, PERA, PPC on December 9th, 2012
In the previous post, I mentioned that PERA, in retaining its 8% expected rate of return, was persisting in an unwarranted optimism, one that is likely to end up costing the citizens of Colorado billions of dollars down the line. Part of the evidence was that other municipal pension plans around the nation have recently lowered their expected rates of return. That said, as of 2009, the overwhelming number of plans in the Center for Retirement Research’s Public Plans database were living in what can only be described as Fantasyland, as the following histogram shows:

I’m sure the right part of the graph, which resembles a strong signal from those plans to their taxpayers footing the bills, is only accidental.
In fact, between 2001 and 2009, plans were extremely reluctant to revise their expected rates of return, despite the fact that they rarely met them for more than a year at a time, and continued to fall farther behind in their funding. If you look at actual returns for those years, they don’t come anywhere close to what was projected:

The result is that plan assets haven’t kept up at all with plan liabilities, even in these years when the market has performed reasonably well (Source: Public Fund Survey):

Understanding that many factors go into whether a plan’s funded level increases or decreases, the fact is that looking forward from 2001 to 2009, over the succeeding 21 years, the median plan would have to return about 10.5% over the following 21 years, to make up for having fallen behind in the first decade:

The problem, of course, is that plans have spending requirement every year; they can’t simply choose to sit on their assets and wait for their investments to catch up. It means that low returns in early years require even higher returns in the later years for the plans to return to 100% funded levels, without increasing cash infusions or a reduction in benefits.
One guess as to which will be the plans’, the governments’, and the SEIU’s first choice.
PERA’s Resolute Optimism
Posted by Joshua Sharf in Colorado Politics, PERA, PPC on December 7th, 2012
PERA’s Board recently voted to retain its wildly optimistic expected rate of return of 8% over the next 30 years. The decision has the effect of reducing the unfunded liability twice – once through higher returns, and again because they mistakenly use the rate of return as the discount rate. Remarkably, PERA’s board made that decision even as pension plans all over the country are reducing their expected rates of return.
The latest is the Orange County Employees Retirement System, which called a special meeting for Thursday evening to lower its expected return from 7.75% to 7.25%. It follows CalPERS, CalSTRS, and about 40 others of the 126 public plans in the National Association of State Retirement Administrators’ Public Fund Survey.
The most direct parallel is the change made only Tuesday by the Pennsylvania Municipal Retirement System, which lowered its expected rate of return from 6% to 5.5%, starting January 1. PMRS’s returns closely track those of PERA, returning an annualized 0.5% less per year over the last 10 years than PERA:

That comes to an annualized rate of 5.3% over the last decade for PMRS, or just below their new rate of 5.5%. PERA’s barely done better, and 5.8%, but insists on retain an industry standard, and wildly unrealistic, 8% expected rate of return.
Note that PERA’s average rate of return is 6.9%, while its cumulative average return is 5.8%. Of course, you can’t spend average returns, you can only spend cumulative returns. Yet another reason for PERA to be more, rather than less, conservative.
On the other hand, it must be encouraging to see PERA’s resolute optimism at a time when so many other plans are losing heart.
Many Not-So-Happy Returns for PERA
Posted by Joshua Sharf in Budget, Colorado Politics, PERA, PPC on June 26th, 2012
As PERA prepares to release its 2011 Comprehensive Annual Financial Report, keep an eye on 2011’s returns. Treasurer Walker Stapleton understatedly calls 2001’s anemic 1.8% return, a “serious warning sign.” I’d call it a big, red, flashing LED billboard.
“What’s the big deal? It’s only one year,” I hear you cry.
Well, it turns out that if you’re projecting returns over a long period, the early returns have a disproportionate effect on whether or not you’ll make your targets. And while PERA projects an overly-optimistic 8% annual return, even meeting that as an average cumulative return is no guarantee of solvency to the end.
Returns aren’t smooth, they vary over time, and while the exact distribution is a matter of dispute, that fact isn’t. While the actuarial outlays are relatively smooth, returns can bounce around all over the place, and poor early returns can mean that you’re eating into your principal, and won’t be able to make it up on the back end, even if the returns rise to meet your project cumulative average.
Take three sets of return profiles, one constant, one with slightly higher-than-expected returns the first two years, and one where the fund loses 5% a year for the first two years, but settles in at a higher rate.

All of them converge to the save Cumulative average at the end of the 20-year run:

But because they have to take money out each year, the end of year balances tell a starkly different story for the three funds:

One fund slowly declines from $1 million balance to $800K. The one with higher early returns also declines, but ends up above its starting balance. And the one with poor early returns never recovers.
In fact, 20 data points is a very small sample, and even a distribution of returns that averages 8% could easily produce, over 20 samples, returns far higher or, more likely, far lower. The graph below shows the average returns and final balances from a 10,000-run Monte Carlo simulation:

Below about 10%, there’s a virtual guarantee that some of the funds will go bankrupt. Let me emphasize that this is a very simplified model, for display purposes only. Do not try this at home. (Actually, go ahead and try this at home. You’ll probably be as depressed and I was.)
What this shows, though, is that even using a lower rate of return doesn’t necessarily guarantee the fund’s soundness, and certainly doesn’t model the fund’s future. The only way to do that is through a Monte Carlo simulation, using the historical returns of the assets in which the fund is invested.
While more complex to do, and very hard to model on a spreadsheet, there is precedent for incorporating Monte Carlo modeling into financial planning, pension solvency analysis, and even into accounting. The Black-Scholes method, for instance, is used to calculate the value of stock options granted to employees and expensed on corporate financial statements. And allowances for bad debt are routinely audited for fidelity to previous customer defaults. There’s no reason that we couldn’t require pensions to do the same.
At the very least, it would perhaps keep today’s 1.8% return announcements from being such a surprise, and from taking such a toll on PERA’s solvency estimates.
PERA’s Portfolio Allocations
Posted by Joshua Sharf in Budget, Colorado Politics, PERA, PPC on May 23rd, 2011
In yesterday’s Denver Post, PERA’s Chief Investment Officer, Jennifer Paquetteis, responded to an op-ed by investment professional Blaine Rollins (“Hope Is Not An Investment Strategy“) that detailed the risk that PERA has taken on:
PERA has instead relied on solid investment strategies created under the direction of the board of trustees with the help of highly experienced staff and consultants. PERA’s investment strategies match its mission, with an investment horizon of decades and a focus on maintaining the stability of the fund.
…
These investment returns allow PERA to provide reasonable benefits for public servants without placing an excessive burden on taxpayers.
In a previous post, I noted that as a whole, US government pensions had shifted to taking on more risk over time. Interestingly, this does not appear to be the case with PERA:
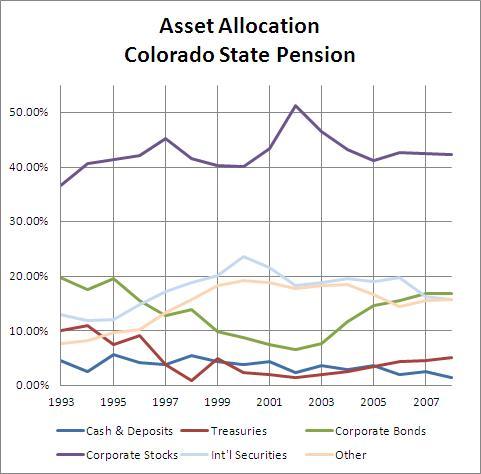
Seeing that stocks, as they appreciated in 2002, were becoming a disproportionately large share of the portfolio, managers shifted those investments to corporate bonds, which tend to have lower yields, but generally assume less risk. They have also – albeit slowly – grown the proportion of their investment in Treasuries. While I believe that PERA’s overall investment mix still has entirely too much risk built in, it is hard to argue that they have gone around chasing higher yields, or allowed their asset allocation to get out of whack when one class outperformed the others.
The problem is, Ms. Paquetteis’s conclusions don’t necessarily follow from her premises, especially over the long term. Paquetteis’s response only addresses whether or not PERA is following reasonable portfolio diversification techniques. It fails to address the underlying problems with those techniques: the large unfunded liability, the added year-to-year risk associated with needing larger and larger returns, and the faulty accounting standards that not only permit, but actively encourage taking on that extra risk.


