Archive for category PERA
Real Returns and Solvency – Part I
Posted by Joshua Sharf in PERA on August 4th, 2013
One of the biggest problems with the way that pension plans report their solvency numbers is the assumption of constant returns over the life of the plan. By assuming constant returns, plans end up hiding the single biggest factor in why they’re likely to go bust: risk. This post will try, with a hugely (and unrealistically) simplified example, to illustrate the problem this poses when trying to figure out whether a plan has enough money to cover its liabilities.
For this first cut, the aspect I want to capture is that with mandatory annual outflows, a pension fund puts itself at risk of falling behind, and never being able to catch up.
Let’s take this example: a $1,000,000 liability, timed to last 30 years, with $250,000 annual payouts, and payments into the fund that are calculated based on the expected return on assets. Here’s what the fund balance will look like if we assume a constant 8% return on assets:

Payments into the fund each year are calculated to be a little over $161,000 a year in order to make this happen. Also note that all this is being conducted in real dollars; we’re ignoring inflation, which is going to drive some people up the wall, but 1) we can always make a calculation in real dollars, 2) there’s really no good way of predicting inflation over a 30-year span, and 3) this is a thought exercise.
Where can I get an 8% a year return for 30 years? Well, I could put it in bonds that return 8%, but those may not always exist. Right now, we have a low-interest rate environment, and even corporate bonds that are highly-rated don’t necessarily return 8%. Surely investment-grade municipal bonds don’t get me 8% at 30 years. And remember, I need to find a place to put each year’s inflow, so by the end of the 30 years, I’m unlikely to find a 1-year corporate or municipal bond that pays me 8%, absent a pretty severe inflationary environment.
One investment that is liquid, that also provides reliable 30-year returns over 8%, is the S&P 500 index of large-cap US stocks. The S&P has been around since 1926. So starting in 1955, we have 30-year return profiles for it. Here’s the distribution of annualized 30-year returns for the S&P 500, from 1955 – 2011:

The thing has never returned less than 8.5% over that time, and averages 11.76% (although the median is lower). This is a period of time that covers a World War, a Depression, inflation, the Korean and Vietnam Wars, the 2000 Tech Bubble Burst, and the 2008 Real Estate Bubble Burst. That’s a pretty good track record.
Here’s the rub. Here are the annual S&P 500 returns over that time:

Not so good. You have a pretty good chance of losing money; in 11 years out of 85 you’d be down 10% or more, and in 6 of those years, down 20% or more. In three of those years, you’d lose 35% or more of your total investment. You can see the problem: the risk of running one really bad year, or a couple of moderately bad years, early on, where you might have to spend your seed corn, is high enough to be worrisome, even if the total 30-year return is comfortably higher than your planning.
In order to see our imaginary fund’s chances of making to 30 years solvent, we need to put in not a constant 8% return, but a random variable that looks like the S&P 500 annual return. Surprisingly, there’s considerable debate over whether or not such a variable is even possible to construct. The returns are clearly not normally distributed, and adding more moments (skewness, how fat the tails are, etc.), doesn’t produce unique random variables. When you look at the returns, it also looks as though the year-to-year returns may not really be independent, either; that is, a losing year seems to follow another losing year.
Given all this debate, I just figured that, with 57 separate 30-year runs available to us, the easiest thing to do would be to use those 30-year runs themselves. I.e, 1956 – 1985, 1957 – 1986, etc. Here’s a pretty typical return profile:

One really bad year, a couple of downers soon after, but positive almost all the time, and a number of eye-popping returns of over 40% to make up for it. Should work out, ok, right?
Not so much:

The actual balance in the account falls below the projection in Year 9, and never really is able to gain altitude again. By Year 20, the fund is bust, and has to either get bailed out or stop making payments.
What’s interesting is that it’s not the Year 6 Catastrophe that does the fund in. Given the good years that preceded it, the balance after Year 6 is right at the projected levels. A fund manager could easily persuade himself that everything’s going to be ok. What really causes the problem is the two bad-but-not-disastrous Years 9 and 10 consecutively. The S&P comes back in consecutive years with 20%, 25%, 20%, 35%, and it’s still not enough to put any real air between the balance and the ground. So by Year 15, when the S&P loses less than 10% – less than it had lost in any of the previous losing sessions – it’s effectively all over.
How often does this happen? Well, here are the failure rates for various return assumptions, starting with the average of 11.76% that the S&P actually returns, and going to 7%, for the ultra-conservative fund manager:

The manager who doesn’t leaving himself any breathing room cashes out over 60% of the time, which might be a little surprising. It’s not until we assume a 10% return (corresponding to annual pay-ins of $143,000), that we get to a 50-50- chance of seeing 30 years. Our 8% manager still fails over a quarter of the time, and it’s not until we get past a 7% assumed return (pay-ins of $169,000) – where we’re effectively giving up 40% of the actual S&P historical return in our planning, that we almost get to an 80% chance of solvency in Year 30.
Now, to be clear, you don’t end up in such bad shape most of the time that you don’t go bust. You’re often well in the black. For the fund manager who’s planning on 7%, he ends up over $10,000,000 in the black over a third of the time. So often, when you win, you win really big.
But in pensions as in baseball, you can’t spend those winnings from other timelines. The Cardinals beat the Reds 15-2 today, but tomorrow, it’s 0-0 when the pitcher takes the mound. My concern as a pensioner is being able to plan on a certain amount of money coming my way after I retire. If the plan goes bust when I’m 75, it’s too late for me to make other plans. And if the plan ends up with an extra $9,000,000 on-hand when I’m 80, there’s not much benefit in that, either. The cost of losing is very, very high; the unlikely rewards from extra winnings don’t make up for that, which is why I put my money into a “safe” pension plan in the first place.
Understand, as stated at the outset, this is a hugely simplified example, on about 100 different levels. Real pension plans don’t consist of a single individual. They generally don’t make payouts at the same time they’re collecting contributions. The lifetime of the plan for an individual is longer than 30 years. Their portfolio is more diversified than putting everything in US stocks. Inflation actually matters to pensions, possibly for benefits, certainly for wage calculations.
But the basic point – that the actuarial assumptions of flat returns, assumptions that fail to take into account risk as well as reward – are serious planning flaws that can ultimately lead to a plan’s demise.
My hope is, over time, to make these models more complex, remove some of the simplifications, give something approaching actual likelihoods of Colorado’s PERA going bust, and ultimately, create an online model where you, the reader, can enter your own assumptions and see what happens to PERA’s long-term prospects. That’s a big project, and it’s going to take a long time to complete. But there’s nothing in the finish product that isn’t here in the basic principles: returns move around all over the place, and the cost of providing ownership in a liability rather than an asset can be ruinous.
The PERA Fire Sale, The Gift That Keeps On Taking
Posted by Joshua Sharf in PERA on August 1st, 2013
Over at the Denver Post, Vince Carroll details the price that PERA has been paying for its “fire-sale” of pension benefits from 2001-2005:
There are many PERA beneficiaries like Coffman who bought years of service — often at a very advantageous discount — and who now receive pension checks larger than you would expect based upon the span of their careers.
A large number of those transactions occurred over a three-year period a decade ago, when “PERA conducted what one executive called, in retrospect, a ‘fire sale’ on the service credit,” according to a 2005 analysis by the Rocky Mountain News.
The administration of Gov. Bill Owens, in a major blunder, lobbied for the fire sale as a shortsighted way to encourage early retirement and infuse new blood into the bureaucracy.
As Carroll notes, this problem was known as early as 2005, when David Milstead of the late, lamented Rocky wrote about it:
But the deal got sweeter. Gov. Bill Owens, then in the early part of his first term, wanted to streamline government and bring new employees into the state work force. In 2000, with his encouragement – some say pressure – PERA cut the already-low price of purchasing extra years by 14 percent, to 15.5 percent of salary.
Owens said he doesn’t recall the specifics of what was said to PERA, but “I thought it was valuable to have the flexibility to get new employees into some of the positions in the state bureaucracy.”
…
Service-credit purchases kicked up by 38 percent in 2001, topping $100 million.
PERA decided to raise the price back to 18.1 percent of salary for members under 50 and increase it to 22.1 percent for older members. But they told employees it wouldn’t happen until November 2003.
Given that window, thousands of employees raced to the sale.


It also calls to mind an excellent article by Josh Barro in National Affairs, “Dodging the Pension Disaster,” where he suggests a way (perhaps) to actually reduce the unfunded liability after a defined benefit-to-defined contribution transition:
A working paper by Maria Fitzpatrick, a fellow at the Stanford Institute for Economic Policy Research, attempts to determine just how highly some public employees value their pension benefits. She examined Illinois teachers’ choices when, in 1998, they were offered a chance to make a one-time payment up front in exchange for more generous benefits in retirement. The terms of the purchase varied significantly depending on a teacher’s salary and years of service. Using reasonable discount rates, the up-front purchase cost was lower than the present value of benefits for nearly all teachers — 99% could expect at least a 7% annual return on investment, with no risk so long as the state did not default. But the deal was sweeter for some teachers than for others, a variation that made it possible to estimate the subjective present value that teachers placed on future benefits.
Fitzpatrick’s finding is, in a way, depressing: On average, teachers were willing to pay only 17 cents on the dollar to obtain a pension-benefit increase. This suggests that defined-benefit pensions are a highly inefficient form of compensation, costing taxpayers far more than they are worth to public employees.
But it also suggests an appealing policy solution: Governments can offer to buy back promised pension benefits at a discount, and employees may be inclined to take the deal. Admittedly, the proposal presents a political problem to lawmakers, in that it requires them to produce an immense sum of cash up front in order to eliminate a long-term liability. To alleviate some of that pain, however, governments could responsibly issue bonds to raise the money — since this would mean simply substituting explicit debt for a larger amount of implicit pension debt. Governments would incur an obligation to pay interest on the bonds, but in most cases that amount would be more than offset by the reduction in required employer pension contributions.
In Colorado’s case, the price was about 15.5 cents on the dollar, but there was huge interest, so a fair price may be considerably higher than that. Add to that the fact that people are often less willing to let go of a perceived cash benefit than they are to buy it in the first place, and there’s reason to think we can’t possibly buy it back for 15.5%. Still, having a limited-time “open season” market, or Dutch auction, with a declining price, might be a way of disposing of some of the liability.
PERA’s the price for purchasing service credit has since returned to reasonable levels, we’ll be living with the cost of selling long-term debts cheaply for a long time to come. At this point, it’s almost impossible to tell how much of PERA’s long-term debt obligation comes from this sale; I can’t find aggregate numbers in the CAFR, and the charts above show only the price paid, not the goods sold, but it certainly warrants further investigation.
PERA’s Premature Celebration
Posted by Joshua Sharf in PERA on June 28th, 2013
This morning, the Denver Post carried a story about PERA’s “celebration” over a 12.9% return on its investments in 2012, and how it allegedly puts to the lie to State Treasurer Walker Stapleton’s concerns over the solvency of the pension plan.
Would that it were so, but PERA is, as usual, spiking the football on this one too early.
First, let’s start with the return itself. 12.9% is good, but it’s not exceptional, as PERA returns go. It’s above the 8% that they assume over the next 60(!) years, in order to get the funds to be solvent over that time, to be sure. And it’s only possible because a higher return means a higher volatility. As we’ve said before, PERA only needs to have a couple of bad years to fall so much further behind that it can’t catch up. This year’s modest gains in its funded levels could easily be wiped out by even a couple of average years that see positive returns in the 5% range.
As an aside, we should also note that PERA’s returns follow the returns of the much larger California pension system, CalPERS, almost exactly:
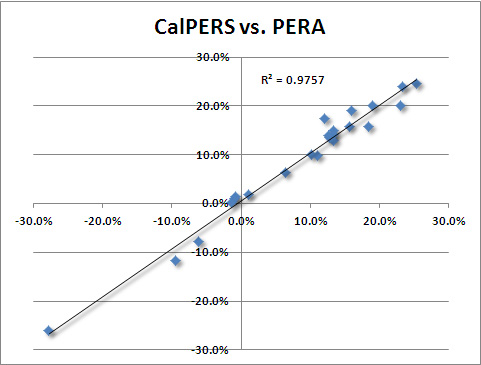
The 12.9% is below PERA’s self-imposed benchmark of 13.4% – with Alternative Investments doing the worst relative to its benchmark. It’s right at BNY Mellon’s Median Public Fund average return of 13.0%. And it’s right in line with what you’d expect, given CalPERS’s 13.3% this past year. If PERA is willing to declare victory for missing its own benchmarks, and doing just about as well as everyone else, we should perhsaps be asking what we’re actually getting for all that money management staff we’re paying.
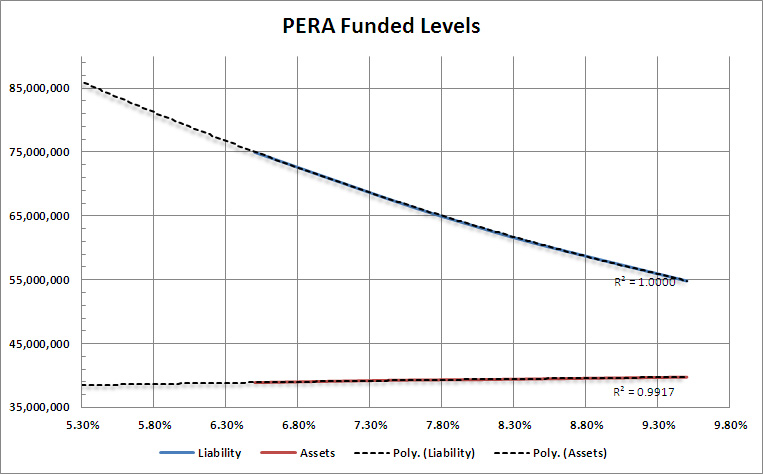
Worst, though, is that PERA’s situation really hasn’t improved all that much, and remains far worse than they’re willing to admit. PERA discounts its liabilities using the expected rate of return on its investments, per the Government Accounting Standards Board (GASB) rules. There are a number of problems with doing this, first and foremost being that it encourages funds to take on more risk in order to appear better-funded. It’s also unsound financial economics. Every other pension rule in the world requires the fund to use its parent entity’s long-term cost of borrowing. In this case, that would be best approximated by Colorado Certificates of Participation, currently trading at 5.3% yield. PERA provides a sensitivity analysis of various discount rates, and it’s not too hard to extend it back to a rate of 5.3%. (There’s also a very slight change in the actuarial value of the assets; I’ve included that just for completeness).
So basically, properly calculated, instead of having the unfunded liability of just over $24 billion that PERA admits to, it’s actually in the hole for about $47 billion, or about $23,500 per household. A more accurate number could be gotten with a more detailed analysis, but this is probably within a billion or two dollars, which suddenly doesn’t seem like all that much money.
PERA likes to claim that the actual unfunded liability doesn’t really matter all that much, since it can’t ever be called in tomorrow, but must wait until it’s actually due. Like so much else PERA says when it comes to its unfunded liability, this fundamentally misunderstands the nature of present value. The point isn’t whether or not a liability can be collected tomorrow. Present Value is just a means of comparing a future liability and present assets in today’s dollars, a way of asking how much you would pay today for the promise of the amount of the liability tomorrow (or whenever it’s due). It has nothing to do with whether or not such an immediate transaction is possible.
However, we can calculate how much the unfunded liability will mean to Colorado families when they have to make it up. Right now, a $23,500 debt, paid at PERA’s assumed return of 8% over 30 years, is about $2,000 per family, per year.
Save the champagne.
As relates to another story – PERA’s baleful effects on school budgets, the release of the CAFR gives us a chance to update our school spending charts. There’s some improvement in the growth rates, even as they continue to far outpace inflation. And in the School Division, the increase is coming entirely from the taxpayers.


Who’s Panicking?
Posted by Joshua Sharf in PERA on May 15th, 2013
Last week, former PERA Executive Director Miller Hudson penned an op-ed for the Denver Post, arguing that PERA’s situation has improved to the point where we need not worry about it, and that no further tinkering with it is necessary (“There is no need for panicky ‘fixes’ to PERA“). Unfortunately for the taxpayers of Colorado, Mr. Hudson’s comforting conclusions are belied by some uncomfortable facts.
Let’s begin with where Mr. Hudson places the blame for the current funding problems. He identifies one of them correctly – overly generous benefits that amount to promises that cannot be kept, except at great expense. He is also correct that the dot-com bubble was fool’s gold for the legislature, which led it to create the overly-generous benefits.
But PERA’s portfolio managers (who predate Mr. Hudson’s tenure as Executive Director), allowed the fund’s investments to become dangerously overweight in volatile stocks, in effect letting their winning bets ride. When the dot-com bubble burst, so did PERA’s funded ratio, and it continued to decline throughout the decade, recovering only slightly in the mid-00s:
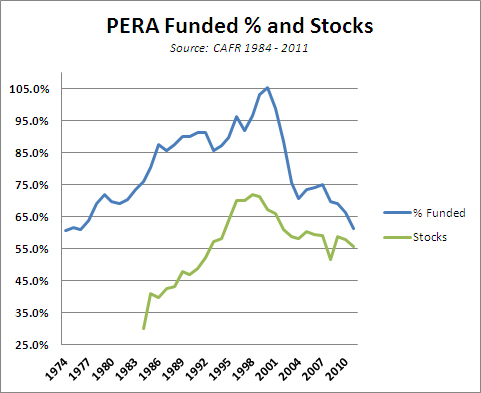
This chart also shows the folly of relying on long-term returns to determine a fund’s solvency. If a plan is underfunded, adding additional return may look like the way to catch up. But along with that additional reward comes additional risk and volatility. When the portfolio has a bad year, as in 2000, 2001, and 2008, it doesn’t have the option of drastically reducing its payout that year, as you or I would with our own retirement accounts. The need to pay benefits regardless of the fund’s annual return can put it in a hole that it can never recover from. PERA’s estimate of 8% may indeed be a realistic return over 30 or 40 years. But benefits need to be paid when they need to be paid, and the results of this thinking are all too obvious in the above chart.
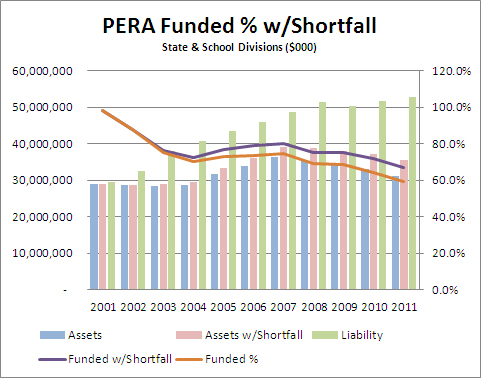
And while the legislature rarely met its Annual Required Contribution (a contribution set by Government Accounting Standards Board, and designed to ensure actuarial soundness), this shortfall was only a relatively minor factor in the fund’s increasing unfundedness. According to the chart below, had the legislature made the ARC every year from 2000 on, the State and School Divisions, which comprise the overwhelming part of PERA, would only have been about $4 billion better-off last year. PERA admits to a $23 billion unfunded liability, although there is reason to believe it is much larger:
Mr. Hudson also argues that, because overall, PERA contributions account for less than 3% of public spending, the burden is light. This ignores that for many entities – school districts, in particular – PERA spending is eating up an increasing portion of their operating expenses:
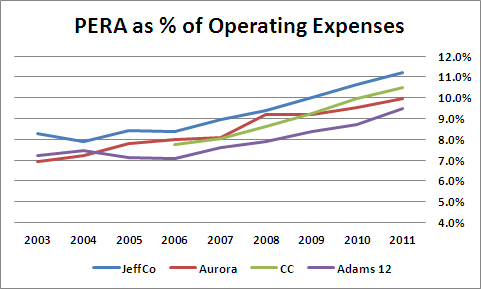
This is a result of the very supplemental payments (SAEDs) that are designed to save the system from ruin. PERA is correct that the supplemental payments were envisioned as being shared between the districts and their teachers. But with many, if not most, school boards under the thumb of the teachers’ unions, they have decided to have their districts absorb the entire supplemental payments. This means that as of 2011, for four major Denver-area school districts, roughly 11% of their operating expenses were going to teacher pension plans, money that could have gone into the classroom.
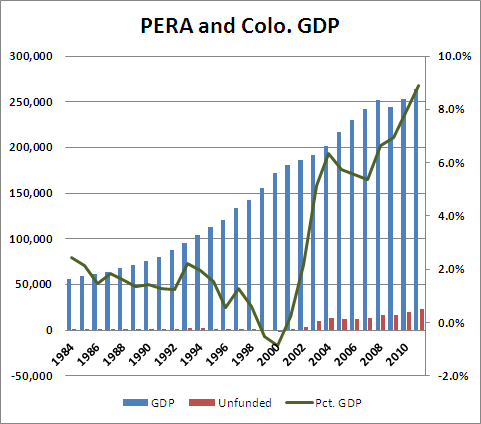
Mr. Hudson tries, implicitly, to discredit those who are concerned about PERA’s fiscal condition by claiming that it is only “in recent decades” that concern has grown up around the unfunded liability. While it is true that in the past, PERA has been significantly under-funded, two conditions make that of greater concern now. First, the PERA unfunded liability is much larger now as a percentage of the state GDP, meaning that should a fix become necessary, the pain to the state’s taxpayers will be considerable greater than it has been in the past. In the 1980s and early 90s, the unfunded liability hovered around an unthreatening 2% of state GDP. That has since grown to 9%:
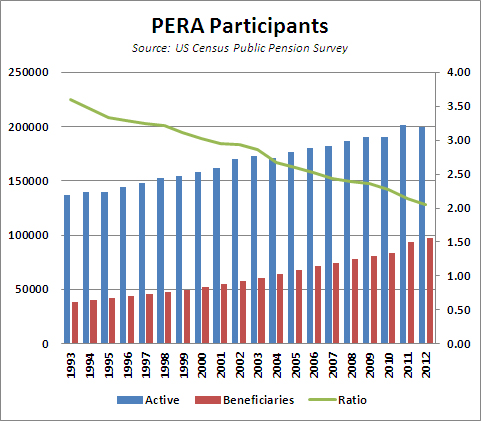
Second, since PERA has an unfunded liability, it means that some of its current expenses are paid for by current employees. (A fully-funded program would, by definition, have all current expenses in the bank.) The ratio of current employees to retirees has been falling for decades, as well, meaning that any increases in contributions will fall more heavily on future employees and future taxpayers:
As part of his rhetoric, Mr. Hudson contrasts the concrete – and real – improvements from SB10-001 with unnamed and undescribed “fixes” proposed by those who worry about PERA’s financial condition. This leaves the reader to imagine all sorts of horribles. Let’s look at some of the “panicky” fixes proposed in the state legislature over the last several years:
- HB13-1040: Would have calculated benefits on the basis of seven, rather than three years’ pay, making “spiking” more difficult to achieve
- SB13-055: Would have applied the same liability discount rate rules to PERA as apply to US private pensions and European public pensions
- HB12-1142: Would have given all PERA members the option to join PERA’s own defined contribution plan
- HB12-1179: Would have broadened the composition of PERA’s board to reduce conflicts of interest and increase accountability
- SB12-016: Would have given local governments the same option the state government has to make plan members pick up more of their benefit contributions in times of fiscal distress
- HB12-1250: Would have calculated health care benefits on the basis of costs, rather than employees’ salaries
- SB12-082: Would have set the PERA retirement age to that of Social Security for non-public safety members, a matter of basic fairness
- SB12-119: Would have forced PERA make adjustments until its plans could meet a 30-year amortization window, the standard for pensions
- SB12-136: Would have included PERA benefits in the state’s Biennial Compensation Report
All of these changes are designed to increase transparency, increase accountability, and decrease conflicts of interest. All of them are designed to increase fairness, and increase the likelihood that PERA retirees will be able to rely on promises made to them.
It is telling that each of these changes – every last one – has been opposed by PERA and its allies in the public employees unions here in Colorado.
And it’s enough to make you wonder who’s really panicking.
Yes, PERA Is Worse Now
Posted by Joshua Sharf in PERA on May 14th, 2013
Defenders of PERA often argue that while the liabilities have been under-funded in the past, it is only now that PERA’s critics have begun to worry about the matter. The implied message is that the complaints are political, rather than financial. Here’s why this isn’t the case:
Yes, Colorado’s economy has grown, but the PERA liability has grown faster. While through the 80s and most of the 90s, the unfunded liability hovered around 2% of the state’s GDP, since 2000, it has grown to 9%. Of course, during the good economic years, it declined somewhat, and it may well decline a little again this year, as PERA’s returns are expected to be around 12% on its portfolio. But sooner or later, we will hit a cyclical recession, and even as the economy shrinks, PERA’s unfunded promises will continue to accumulate.
Why PERA’s Presumptions Are Faulty
Posted by Joshua Sharf in Colorado Politics, PERA, PPC on March 28th, 2013
Did you recognize the faulty presumptions in PERA’s spirited defense of defined benefit plans?
You have been given a false choice about why defined benefits plans are better than defined contribution plans.
In a recent EdNews Colorado Voices column, Colorado PERA Executive Director Greg Smith avers that PERA’s existing defined benefit structure best serves both the teachers and the taxpayers of Colorado. He was responding to a report by the National Council on Teacher Quality that leads the reader to support reforms to move away from the existing scheme and toward a defined contribution plan. Smith’s claims are wrong about the advantages of defined benefit plans in general, and PERA’s actuarial soundness in particular.
Smith cites a National Institute on Retirement Security (NIRS) report that claims three advantages for defined benefit plans over defined contribution plans:
- Less error in the amount saved for retirement,
- Less need to rebalance and re-allocate assets over time, and
- Better returns, largely as a result of lower transaction costs.
Each advantage turns out not to be dependent on having a defined benefit plan, but on having a professionally-managed, aggregated plan. The same advantages would accrue to a similar defined contribution plan that was also aggregated and professionally-managed.
PERA already has such an option, PERA Plus. It’s organized as a three-part 457(b) / 401(k) / Defined Contribution option. Like any set of diversified retirement offerings, it includes a variety of funds with different investment goals. For our discussion, the most relevant set of funds are those with target retirement dates. PERA has nine of these, with target dates every five years from 2015 to 2055, and an Income Fund designed to provide current income for current retirees.
Over time, as the target date for each fund approaches, that individual fund reallocates its assets into more conservative investments, before maturing and merging into the Income Fund. While each individual fund “ages,” all the funds collectively are maintaining a proper average. Taken together, they continue to represent the aggregate ages and target retirement dates of the entire set of members, the very source of the first two alleged advantages. The third, that of lower transaction costs, is completely independent of how liabilities are calculated.
There is no inherent reason why the assets of a DB plan should earn a higher return than those of an identically-invested DC plan. The only mandatory difference is that the defined benefit plan beneficiary has a share only in the specific benefits to be paid – the fund’s liabilities. By comparison, the owner of a defined contribution plan has a property right in the assets. Therefore, while a defined contribution plan is, by definition, always fully-funded, a defined benefit plan may have to seek additional funding, or trim back on its promises, in order to remain so.
The danger of unrealistic promises
It is therefore imperative that the promises being made to future retirees be realistic. All the more so if the promised benefits are being used to attract and retain qualified or exceptional teachers. Unfortunately, it is far from certain that PERA can afford the promises it is making, given its current funding levels. Recent legislative reforms (Senate Bill 10-001 in particular), while welcome and substantial, simply do not close the gap.
By PERA’s most recent published calculations, its unfunded liabilities remain at a staggering $26 billion, and its overall funded level is well below 60 percent, on a par with the chronically ill Illinois public pensions. In fact, a recent study by Barry Poulson suggests that PERA could be in the worst shape of any statewide plan in the country.
Let’s give credit where credit is due. PERA’s adoption of a 401(k)-like portability is indeed commendable. But if it’s designed to mimic the properties of a 401(k), it can hardly then provide an advantage over one.
While PERA is no longer “letting it ride,” as it did with its stock market investments of the late 90s, the 8 percent returns needed for a return to solvency come with risk. Even better-than-average returns during regular years won’t make up for prior losses in bad years, because funds must then catch up, while payments can’t be deferred.
What success SB1 does offer is predicated on both benefit reductions and payment increases. However, a court challenge to the limitation of COLAs to 2 percent has been upheld by a State Court of Appeals, and its future is uncertain at best. Should the lower courts find that limitation not to be justified, most of the immediate reduction in PERA’s unfunded liability will be wiped out.
On the contribution side, PERA plans to require supplemental increases, rising incrementally from 2 percent to 5.5 percent until 2018. School districts have been picking up the tab for these increases, rather than passing them on to the teachers themselves, as they are allowed to do. As a result, PERA now absorbs upwards of 15 percent of annual operating expenses in many large school districts, a number that is expected to rise to 20 percent as the existing plan increases for make-up contributions.
Disclosure of ties to lobbying group needed
It is also worth noting that the institute that issued the favorable DB article (NIRS) is the lobbying and public policy arm of the defined benefit public pensions, with a particularly close relationship with Colorado PERA. Smith sits on the board of directors of NIRS, as does Meredith Williams, PERA’s former executive director. Colorado PERA is both a charter member and in NIRS’s Visionary Circle, along with such other public plans as CalPERS and the Illinois Municipal Retirement Fund.
Inasmuch as NIRS is not an independent think tank, but instead is a creation of interested parties to the debate over public pensions, this relationship ought to have been disclosed.
While there is no doubt that total compensation is an important part of attracting and retaining effective teachers, those promises must be grounded in reality. Until realistic arguments are used, PERA will continue to fail not only its member teachers, but also the schools and parents it is intended to serve.
This article originally appeared in EdNewsColorado.
Forty Years of PERA
Posted by Joshua Sharf in Budget, Colorado Politics, PERA, PPC on March 13th, 2013
We’ve been here before with PERA. Sort of. Most people following the issue remember that in 2000, PERA was over 100% funded, and that its funding ratio has fallen steadily since then. What they don’t know is that back in 1974, PERA was woefully under-funded, at about the same 60% funded ratio that it is now. It took advantage of the long bull market to pull itself out of that situation:
Note that as the funded ratio rose, so too did the percentage of the portfolio allocated to common stock (both domestic and foreign) rose, as PERA basically decided to let the bets ride, rather than re-allocate to maintain the lower-risk portfolio. When the bubble burst, they ended up paying the price for having stayed too long at the fair. Now, PERA has returned to a somewhat more conservative allocation strategy, targeting 25% of its money for fixed income, and a target of 58% in stocks. Nevertheless, this is a far cry from the 45% or so in bonds that they held up until 1992 or so, and the nebulous “Alternative Investments,” which includes things like venture capital (and in which I’ve included the Lumber investments), suggests that PERA is still chasing yield there:

So this just puts us back where we were before, right? We climbed out of this hole before, we can do it again.
Not so fast. First, as noted before, PERA’s in a less aggressive portfolio now than it was in 2000. This is a good thing, since it takes out some of the volatility from its portfolio. But it also means that it probably can’t count on a run of good luck to lift it out of unfundedness the way it did last time. Also, as we’ve previously noted, the fall from grace in 2001 and 2002 wasn’t just a matter of poor returns, it was also a matter of increasing liabilities with more generous benefits. That hasn’t gone away.
And not all 60% funded ratios are created equal. Here are PERA’s inflation-adjusted, per-capita unfunded liabilities since 1974 (constant 1983 dollars):

On a per-capita basis, the overhang is about 4x what it was in 1974. So in fact, we’re in much, much worse shape than we were 40 years ago when this roller-coaster ride began.
Public Pensions and Real Returns
Posted by Joshua Sharf in PERA, PPC on March 4th, 2013
In the discussion on public pensions, there’s been a great deal of focus on the projected rate of return. I’ve posted on what I think is PERA’s optimistic 8% here, and on the fact that that’s actually an improvement from the 8.75% that they were projecting as recently as 2002. That said, for pension estimates, their inflation assumptions matter as much as their raw return assumptions. The actuarial consequences of poor inflation estimation are too much to summarize here. But even on the basic question of returns inflation matters: the real return on an investment is the nominal return minus inflation.
Over the last 10 years, public pensions have gotten some credit for modestly reining in aggressive growth assumptions. PERA, for instance, has moved from a 8.75% growth assumption to 8%, and CalPERS has made similar adjustments. Overall, the average growth assumption has dropped slightly from 8.04% to 7.86%. But the average inflation assumption for public pensions nationally has dropped from 4.0% to 3.31%. This means that instead of decreasing the real return assumption has actually gone up from just over 4% to just over 4.5%.


For the record, PERA’s inflation assumption was dropped from 4.5% to 3.75% in 2003, where it has stayed. Both the investment return and inflation numbers are higher than the national average and national median, though.
I don’t really think that the inflation numbers here are unreasonable. And my problem with PERA’s 8% return assumption goes beyond the average itself – 8% has been the historic return on stocks, and doesn’t take into account the additional volatility and risk that come with higher return. But it’s clear that PERA and other plans have been dining out on their flexibility on returns, while the increase in real expected returns goes unremarked-on.
The disconnect also highlights the price we’re going to pay – in accuracy, and eventually in dollars – for using the rate of return as the discount rate. Interest rates are closely tied to expected inflation, and here the funds themselves are admitting that the gap between the rate of return and the proper discount rate has been growing.
PERA – More Retirees, Fewer Workers
Posted by Joshua Sharf in PERA, PPC on March 3rd, 2013
This chart is more or less self-explanatory. Over the last 20 years, the number of workers per beneficiary within PERA has dropped from about 3.6 to just over 2.0:
PERA’s CAFR includes the following disclaimer:
By itself, a declining ratio of actives to retirees and beneficiaries does not pose a problem to a Division Trust Fund’s actuarial condition. However, to the extent that a plan is underfunded, a low or declining ratio of actives to retirees and beneficiaries, coupled with increasing life expectancy, can complicate the Division Trust Fund’s ability to move toward full funding, as fewer active, contributing workers, relatively, are available to amortize the unfunded liability.
This is about right, although even a fully-funded system won’t stay fully-funded for very long under these conditions. Indeed, PERA was fully-funded as late as 2001. In the 90s, PERA’s long-term problems were masked by a tech bubble, and when that burst in 2000, the fund started to fall into an under-funded state that it’s never recovered from. Since under an underfunded defined-benefit plan, current expenses have to be paid for out of current contributions, and fewer workers are pulling the cart for each retiree, the deficient horsepower will have to be supplied by the taxpayers.
Is Legislative Stinginess to Blame for PERA’s Problems?
Posted by Joshua Sharf in Finance, PERA, PPC on January 28th, 2013
One of the favorite tropes of PERA apologists runs like this: PERA was fully-funded in 2001 or so, at which point the state legislature began failing to make 100% of its Annual Required Contribution (ARC). It was then that PERA’s funded level began to drop off. Therefore, if the state legislature had fully-funded the ARCs, today, PERA would not face a massive unfunded liability.
It’s a rhetorical masterstroke, redirecting blame for the current situation on a stingy state legislature that put PERA last in its priorities. And while grounded in a grain of truth, it severely understates and misattributes the nature of PERA’s financial crisis-in-the-making.
The grain of truth is this: the state legislature, beginning in 2003, began to under-pay its Annual Required Contribution. Of course, this affects not only the immediate year, but all future years going forward. Not only is the money from the shortfall not there, but the accumulated return on those dollars aren’t there, either. For this post, I’m just going to focus on the two largest divisions, the School Division and the State Division. They were combined in 1997, and separated again in 2006, so I’ll consider them as a unit.
Here are the yearly shortfalls, along with their future values to the end of 2011 (the latest year for which we have data). The first year for each underpayment is dollar-cost-averaged, so we give half the year’s return, and full yearly returns thereafter:
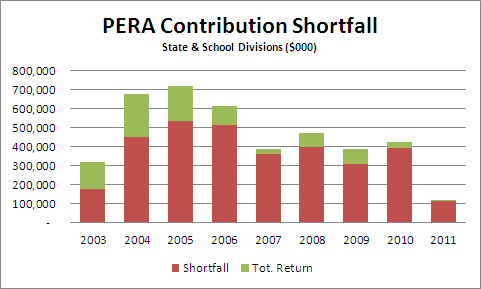
For 2003, the legislature underpaid by about $177 million, costing about $142 million in future returns, for a total effect in 2011 of $319 million. If you add up the total effect, year-by-year, you get the following result:
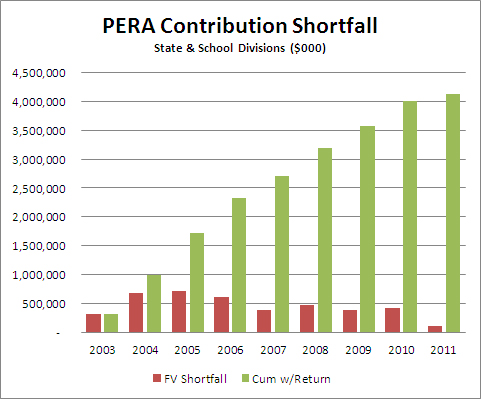
So by the end of 2011, the cumulative effect of 9 years’ worth of funding shortfalls is a little over $4 billion. The argument by PERA hinges on the fact that it’s at 2003 that PERA began to be underfunded:
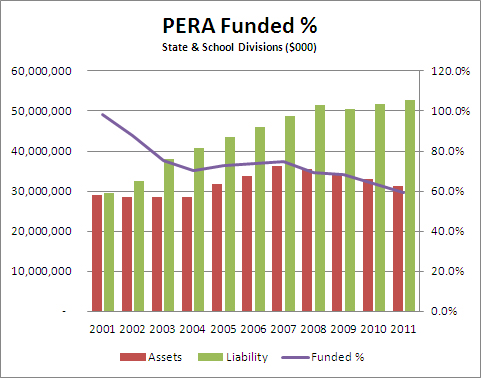
As you can see, though, PERA was already suffering from poor 2001 and 2002 returns, even though there was no shortfall from the state those years. What did increase substantially was the size of the liability; the size of the assets actually held steady. From 2004 to 2007, solid returns managed to keep the dollar amount of the gap from growing. But then 2008 hit, and the size of the obligations continued to increase even as the fund got clobbered in the market. The liability dropped as a result of certain stop-gap changes that were made in 2009, but has since resumed its upward march, even as the actuarial value of the divisions’ assets has continued to fall.
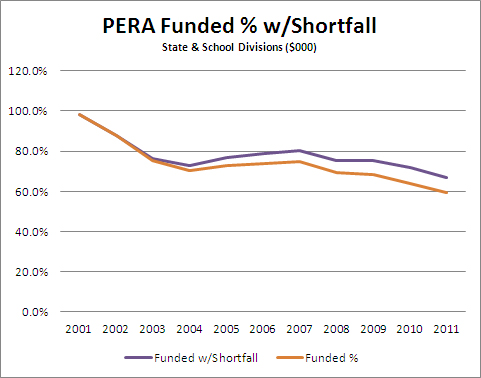
Would it have made a difference if the state had made good on its entire ARC for 2003-2011. The answer is yes, but not very much. Adding in the cumulative shortfall each year, here’s the effect on the assets and the funded ratio for the State and School Divisions:
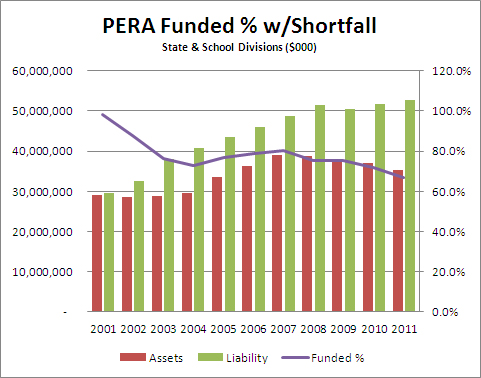
Despite some increased, they’re still seriously underfunded. Since it’s difficult to see the difference between the two charts, I’ve made the comparisons here. First, the difference in assets:
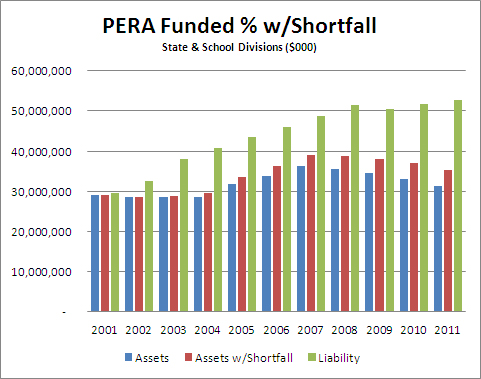
An increase of total assets from $31 billion to $35 billion is not nothing, as they say down at the station, but it’s also not nearly enough to start to close the gap with liabilities. So little that the difference in funding ratio barely moves the needle:
For those of you who want it all on one chart, possibly for optical exams, here it is:
In reality, it’s worse than this. Prior to 2006, PERA didn’t report a sensitivity analysis on its assumed rate of return, so we have only the values for 8%. If we assume a more realistic 6.5% return going forward the unfunded liability grows from $25 billion to about $40 billion, and the extra $4 billion makes even less of a dent.
PERA isn’t suffering from a legislature that isn’t keeping its promises, it’s suffering from having made promises it can’t keep. And it’s the very PERA members who are going to get hurt the most, the ones who’ve been sold a bill of goods about what’s waiting for them when they retire.
-
You are currently browsing the archives for the PERA category.


